
AST31 – Application Portfolio Cost Analysis
| RPM Analytics Catalog ▲ | RPM Assets Analytics ▲ | RPM Analytic AST31 ▼ |
|---|
| Overview |
|---|
|
| Business Outcomes | Supporting Capabilities |
|---|---|
|
|
| User Parameter Configuration (Information for Planview Administrators) | |||
|---|---|---|---|
| Parameters | Description | Configuration Options | Default/Example Settings |
| Currency | Currency in which the amounts should be displayed | There are several values only if the multi currency option is enabled. Default is the system default currency | Defaults cannot be changed |
| Version | Version to consider | Default is the version specified in the version_id parameter (or version marked as forecast otherwise) | Version_id= |
| Financial Measure | Unit to use to display the numbers | Values are:
|
fm_measure=amount |
| Financial Category | Specify whether costs or benefits/revenues should be displayed | Values are:
|
Financial_category=cost |
| Account Types | Specify the account types that should be considered | This is multi select parameter Values are:
|
There is a line for each possible value: account_type=ACTP$EXP account_type=ACTP$CAP account_type=ACTP$LAB |
| Accounts | Specify the accounts that should be considered | This is a multi select parameter This list takes into account the account type parameter. Defaults to all selected. | Defaults cannot be changed |
| Slice By | Slicer to be used in the charts (and as the grouping column in the table) | Contains:
|
slicer=asst721_asset |
| Period Starting/Ending | Starting/Finishing Month for the interval | Default=Horizon start of the Financial Model Default=Horizon Finish of the Financial Model |
Default cannot be changed |
| Chart Effort By | Timescale to use for the trend chart | Values are:
|
Defaults cannot be changed |
| Max Line Attributes | Number of line attributes to consider in the table | max_line_attribs=2 | |
| Detail Table Layout | Determines format of the detailed data table in the report. User can select a formatted layout, with grouping and expand/collapse, or a plan, flat-table, format that is designed for use when exporting the report to Excel for further data analysis in Excel. | Available Options are: Grouped/Collapsed Plain/Excel Default value is controlled through the table_layout parameter; table_layout=grouped table_layout=plain |
table_layout=grouped |
| Hidden Parameter Configuration (Information for Planview Administrators) | |||
|---|---|---|---|
| Parameters | Description | Configuration Options | Default/Example Settings |
| Table Columns | 2 columns before and 2 columns after the asset name can be defined | The first column will be the one used as the slicer at the right end side of the table there is the Account Name, the Line Item Detail and the period columns (that contain the amounts)+ | abs_level_2_asset asst2_asset asst721_asset asst3_asset |
| Report Title | Configurable report title that appears at the top of the report. | If a longer report title is required, then create additional report_title=xxx entries and these will be concatenated together based on the order in which they are listed in the configuration structure. | report_title=Applications Financial Analysis |
-
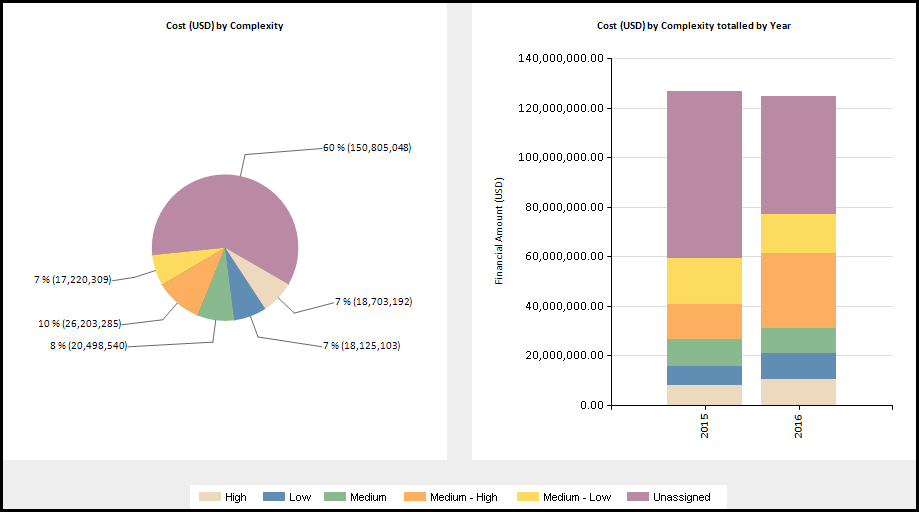
Additional Information Details of the attributes, data types and parameters available for each report dimension: - X Axis – Time Periods; these periods are based on the Enterprise and Fiscal Calendar.X Axis – pie chart/bar chart stacks; this “slice by” parameter offers the ability to slice by the following data types;
- An asset/application dimension (attribute). The available attributes are any asset/application single select alternate structure, any ABS parent levels (above Asset level in the ABS).
- A financial planning line attribute that is common to the financial planning accounts selected, for example the “Providing Organization”. This allows the detailed analysis of project financial data based on the characteristics of the financial values.
- The financial planning account hierarchy (Account Group: Acct Level 2, Account: Acct Level 3)
- Y Axis – Financial Value; the y axis shows data from the financial plan. The following parameters are used to determine what is shown;
- Currency; if Planview Enterprise is configured to support multi-currency then this parameter allows selection of the currency to display the financial values in. Standard currency conversions are used.
- Version; a single active financial plan version can be selected.
- Financial Measure; financial planning can be used to store financial, effort and unit data. Only one measure type can be selected, to ensure that different data types are not aggregated.
- Financial Category; selections are either “Cost” or “Revenue/Benefit”. These are determined by the financial management account configuration.
- Account Types; Capital/Expense/Labor; based on the financial management account configuration, this parameter allows further filtering of the financial data that is aggregated for the Y Axis.
- Accounts; this list is dynamically built based on the prior selections and shows the hierarchy of all accounts configured in the model that fit the Category and Account Type selections.
- Max Line Attributes; this determines how the data is displayed in the table, specifically how many line attributes
Technical/Database Information Report (RDL) Location …/Reports/RPM_PROD/Asset_RPM/RPM-AST31/RPM-AST31_v2.rdl Database This report uses the transactional database and updates will be real-time. Report Developer Info RPM-AST31_v2 RDL is a derivative of the FM31 RDL - X Axis – Time Periods; these periods are based on the Enterprise and Fiscal Calendar.X Axis – pie chart/bar chart stacks; this “slice by” parameter offers the ability to slice by the following data types;