
WRK22 - Risk History Analysis
- Last updated
- Save as PDF
Overview
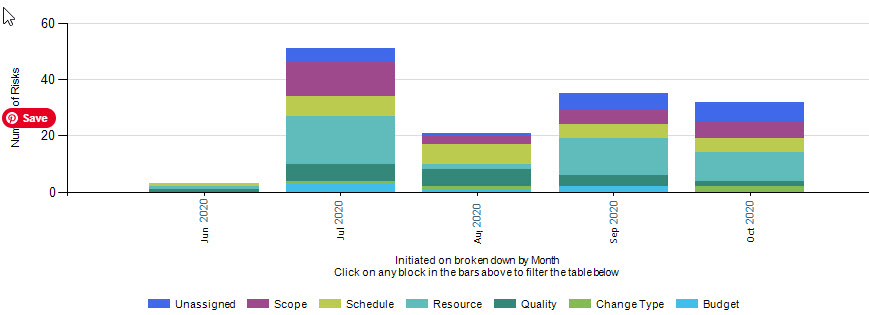
Risk Register analysis for a portfolio of projects.
Used to analyze the volume and type of risks and rate at which they are being raised and closed.
Chart is drillable to slice/dice the list of risks by a risk attribute or a project name.
Table shows key risk fields, attributes, ownership and date information.
WRK22 example
Business Outcomes
- Measures the maturity and effectiveness of the risk management processes that are being adopted by project managers
- Allows the identification of trends and to understand the aging of risks
Supporting Capabilities
- Change, Risk, and Issue Management
User Parameter Configuration (for Administrators)
| Parameters | Description | Configuration Options | Default/Example Settings |
| Slice By: | Risk attribute that will be used to categorize change requests and will be visualized as the stacked bar groups. | Any Change/CRI single select attribute, plus project name and activity name. | slicer1=cri1_cri |
| Visualize By: | Defines the date field associated with the Issue that will be used to plot on the X-Axis. | Any Change/CRI date field, including Initiated (created) date and Close date. | visualize_by=initiated_on_cri |
| Breakdown Chart By: | Week, Month, or Quarter time slices in chart or table | Controls the table Options; week, month, quarter |
breakdown_by=month |
| Start/Finish | Date range to be considered | Number of breakdown periods backwards that the report looks.
Note: A value of 12 will include 12 whole time slices, plus the current time slice. |
default_horizon=12 |
Hidden Parameter Configuration (for Administrators)
| Parameters | Description | Configuration Options | Default/Example Settings |
| Table Columns | Total of eight columns available, after the CRI Title. |
cri_code cri_desc1 cri2_cri cri1_cri cri3_cri resp_resource_name_cri cri_targetdate |
|
| CRI Type | Parameter which makes report Risk specific | Because a single RDL (CRI02) is used for all CRI matrix reports, this parameter determines what will be displayed in the report; changes, risks, or issues. | cri_type=R |
| Filter on CRI Attribute ☑ Added in RPM Analytics v2.3.1 |
This configuration entry identifies the attribute that is to be used in the filter. | The configuration entry value is:
|
cri_filter_attrib= The default/unconfigured value is “none” (no filtering) |
| CRI Filter Attribute Value ☑ Added in RPM Analytics v2.3.1 |
This configuration entry identifies the structure_code/sequenceID or user_name of the value to be filtered on (included). | The configuration entry value is:
|
cri_filter_value= The default/unconfigured value is “none” (no filtering) |
| Report Title | Configurable report title that appears at the top of the report. | If a longer report title is required, create additional report_title=xxx entries.These will be concatenated together based on the order in which they are listed in the configuration structure. | report_title=Risk History Analysis |
Additional Information
The stacked bar chart segments are drillable. Clicking the number in a cell will filter the lower table to show the risks counted in the stacked bar segment.
Technical/Database Information
| Report (RDL) Location | …/Reports/FastTrack/Mixed_Use/CRI02-WorkCRIHistory/CRI02.rdl |
| Database | This report uses the transactional database and updates will be real-time. |