
WRK42 - Project Status Process Analysis

Overview
Project or work portfolio based report. A work portfolio report analyzing changes in project status to aid analysis on throughput, volume, and cycle time. Allows further analysis based on project attributes, such as work type or customer.
WRK42 example
Report Detail
Current Work Status Distribution
This chart visualizes the distribution of projects by the work status they are currently assigned, and provides a detailed listing, which can be configured to show key attributes, such as the project manager name.
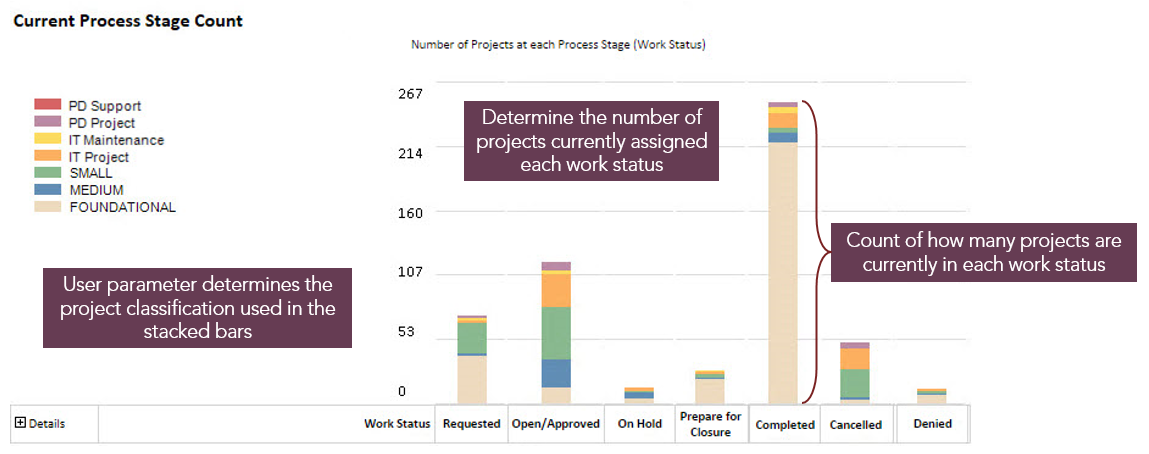
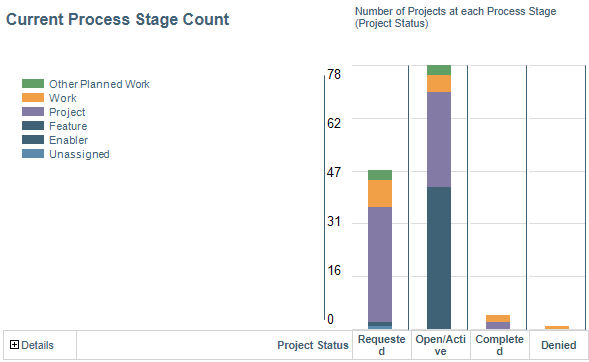
Current Process Stage Count
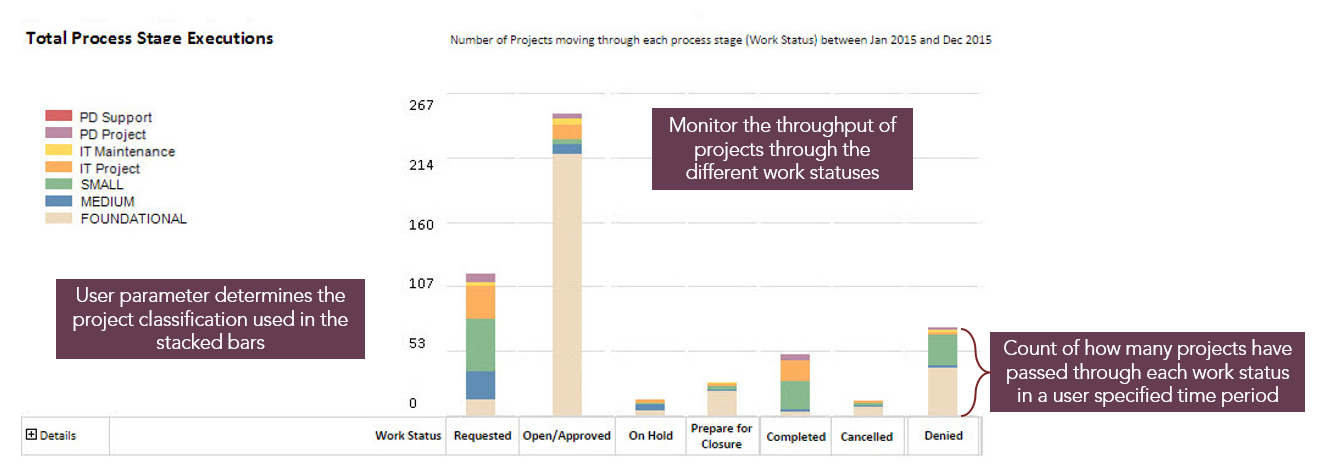
Total Process Stage Executions
This chart summarizes the total number of work status value changes for a user specified time period, for example, the last month, the last quarter, the last year.
Total Process Stage Executions example
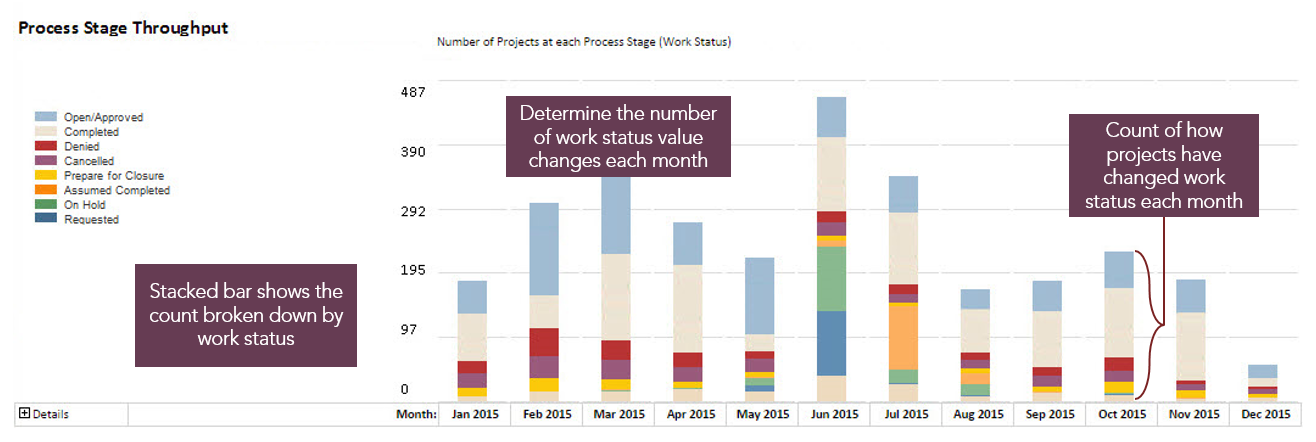
Total Work Status Throughput
This chart summarizes the total number of work status value changes each month, across a user specified time period.
Total Work Status Throughput example
Average Status Cycle Change Time
This chart provides an average cycle time (duration) for each change in work status across a user specified time period. Duration is based on the number of working days between each gate (based on the STANDARD calendar).
User parameters allow analysis by any work classification attribute, such as work type, work priority, or customer, visualized as the stacked bars.
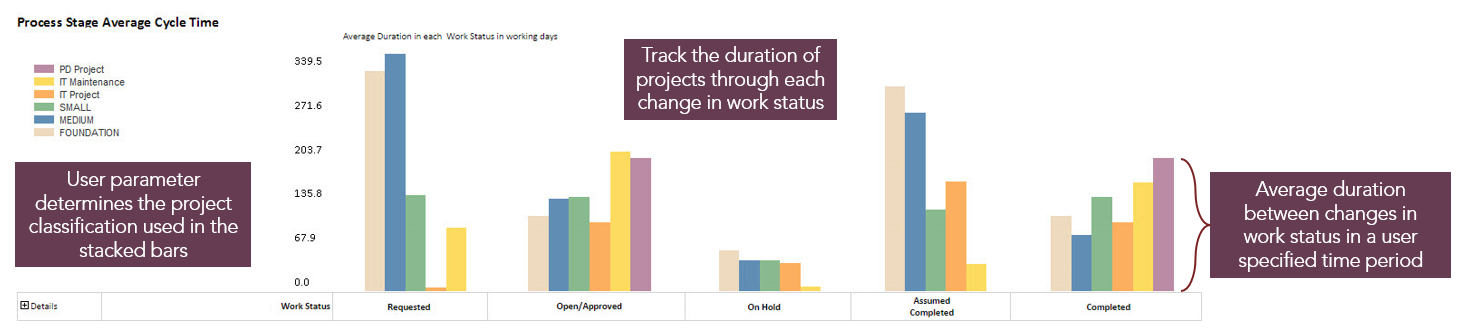
Average Status Cycle Change Time example