
SER32 - Service Portfolio Cost Forecast Comparison
| RPM Analytics Catalog ▲ | RPM Service Analytics ▲ | RPM Analytic SER32 ▼ |
|---|
| Overview |
|---|
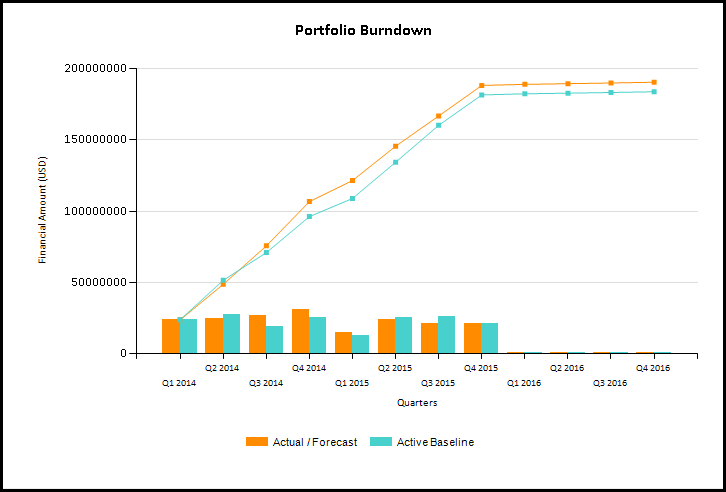
| Service portfolio report that allows the comparison of one/many versions of service and summarized portfolio financial plan data, including effort (FTEs/Days/Hours) or financial cost and recharge data. Includes a burn down chart for the whole portfolio and for each service. |
| Business Outcomes | Supporting Capabilities |
|---|---|
|
|
| User Parameter Configuration (Information for Planview Administrators) | |||
|---|---|---|---|
| Parameters | Description | Configuration Options | Default/Example Settings |
| Currency | Currency in which the amounts should be displayed | There are several values only if the multi currency option is enabled. Default is the system default currency | Default cannot be changed |
| Working Version | Version to consider (This version will appear first) | Default is the version specified in the version_id parameter (or version marked as forecast otherwise) | Version_id= |
| Compare to version(s) | Comparison version(s) to consider | Choose from list of financial versions Default is version marked as baseline | Default cannot be changed |
| Financial Measure | Unit to use to display the numbers | Values are:
| fm_measure=amount |
| Financial Category | Specify whether costs or benefits/revenues should be displayed | Values are:
| Financial_category=cost |
| Account Types | Specify the account types that should be considered | This is multi select parameter Values are:
| There is a line for each possible value: account_type=ACTP$EXP account_type=ACTP$CAP account_type=ACTP$LAB |
| Accounts | Specify the accounts that should be considered | This is a multi select parameter This list takes into account the account type parameter | Default cannot be changed |
| Period/Ending Starting | Starting/Finishing Month for the interval | Default=Horizon start of the Financial Model Default=Horizon Finish of the Financial Model | Default cannot be changed |
| Chart Detail Metric By | Timescale to use for the trend chart | Values are:
| Default depends on the interval size (number of periods between Period Starting and Period Ending) |
| Max Line Attributes | Number of line attributes to consider in the table | Max_line_attributes=2 | |
| Hidden Parameter Configuration (Information for Planview Administrators) | |||
|---|---|---|---|
| Parameters | Description | Configuration Options | Default/Example Settings |
| Table Columns | 2 columns before and 2 columns after the project name can be defined | It is recommended that service parent levels are used in the first two columns. It is recommended that the two columns are used for key status and/or responsibility attributes | srv_level_2_service srv2_service asst701_service serv_techval |
| Report Title | Configurable report title that appears at the top of the report. | If a longer report title is required, then create additional report_title=xxx entries and these will be concatenated together based on the order in which they are listed in the configuration structure. | report_title=Service Forecast Performance |
| Additional Information |
|---|
Details of the attributes, data types and parameters available for each report dimension:
|
| Technical/Database Information | |
|---|---|
| Report (RDL) Location | …/Reports/RPM_PROD/Service_RPM/RPM_SER32/RPM-SER32_v2.rdl |
| Database | This report uses the transactional database and updates will be real-time. |
| Report Developer Info: | RPM-SER32_v2 RDL is a derivative of the FM32 RDL |