
Team Kanban Module Quick Wins – Improve Time to Delivery
Speed Counts in Today's Work Environment
There's a reason so many organizations are moving toward including Agile principles and techniques. Going from project inception to final delivery needs to be quicker and more efficient.
Planview commissioned a global benchmark study in December 2020 to assess how organizations are adapting to change in uncertainty. It found that the most successful organizations are ready to increase the speed of their delivery as demand increases. The findings and insights are revealed in the report – The State of Strategy Execution: Embracing Uncertainty to Adapt at Speed.
62% of Strategy Execution Leaders, who already reported going fastest with the highest quality outcomes, stated they strongly agreed with the statement: “To ensure its success, my organization needs to make decisions and execute faster than it currently does.” (vs. 24% Challengers, 34% Laggards)
The Team Kanban module, powered by AgilePlace, is designed to be a key tool in improving time to delivery within and across teams. It allows teams to clearly track progress and focus on getting work done without unnecessary distractions, allowing those in the PMO or other strategic areas to use analytics to see where a process needs improvement. The use of kanban boards from the team level to the program level makes it easy to attain these goals without a loss in quality. The Planview Team Kanban module, with its board and lane model that can be configured in a variety of ways, is a smart and easy way to both monitor time to delivery and work quickly with both flexibility and consistency. Take this case study from a leading chemicals company, who were able to optimize their processes and drastically increase their time to delivery speed:
"Since implementing Planview AgilePlace, the Maintenance team reduced cycle times from 180 days to just 27, and work order backlogs have decreased from around 9,000 to about 3,000. "
Ready to get started? Here are steps any organization can take to use boards to track and schedule work, build and manage flexible plans, and execute against strategy to deliver more value to customers, faster.
TIP
We're here to help! If you need assistance with implementing any of the steps below, don't hesitate to reach out to your CSM.
NOTE
Prefer to watch videos? Check out the Improve Time-to-Delivery with AgilePlace on-demand webinar, or our AgilePlace video library.
Card Sizing/Points: How Big is Your Workload?
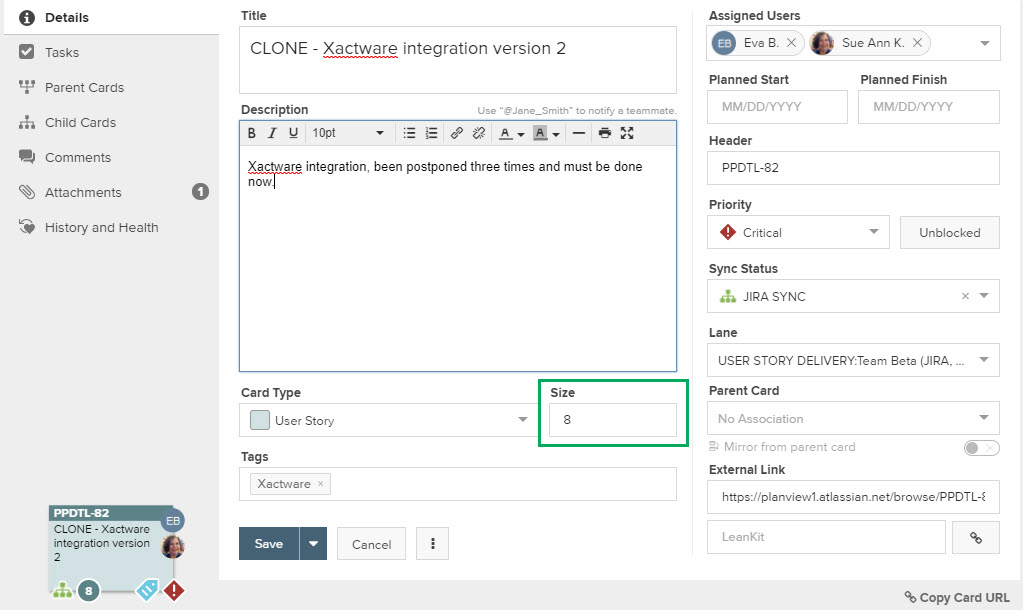
Many teams find it useful to identify and track the size—or amount of work—associated with each work item. The Team Kanban module lets you easily assign a size value to each card and run reports using size as a variable.
Size is an optional field that you can update in the card's Details tab. When you enter a number into the Size box, you override the default card size of 1 and assign the appropriate amount of effort to the work. The card size appears on the face of a card, ensuring visibility for the entire team.
Sizing Approaches
Sizing can help teams plan and groom their backlog, understand how much work is in process at a given time, and analyze metrics such as cycle time and throughput.
Approaches to sizing—or assigning points—vary by team and can range from using a t-shirt size (e.g., 1 equals extra small, 2 equals small, etc.), a scale of 1 through 10, the Fibonacci sequence (1, 2, 3, 5, 8, 13, etc.), or a detailed estimate for hours of effort. In manufacturing, card size is also used to designate how many widgets need to be built—often resulting in much higher card sizes.
Card size using Fibonacci sequence values
While many pure Agile teams don't set work in progress (WIP) limits by card size, or use card size for other purposes, there are valid use cases where card sizes can be used successfully:
- Teams using the Team Kanban module as their visualization method only find that enforcing WIP limits by card size allows them to plan their sprint backlog based on card size, setting a WIP limit for some “sprint backlog” lane either on the left side of the board or in the main backlog.
- Teams outside of software development and IT organizations that use Team Kanban for academic research projects, sales pipeline visualization, marketing plans, strategy canvases, and such find card sizing to be a handy tool for keeping track of their work size.
- Organizations that use the Team Kanban module to visualize and plan at the portfolio level (an enterprise kanban view) often allocate capacity based on size, not just number of items by using card sizing or points.
Using Card Size as a Variable in Reports
Teams can also use card size as a variable in Team Kanban module reports. Calculating analytics based on card size provides useful insight into how effectively work items are flowing through your process. For example, rather than saying the average card takes five days to complete, you could say that the average card with a size of three takes five days to complete and then compare this to the average time a card with a size of five takes to complete.
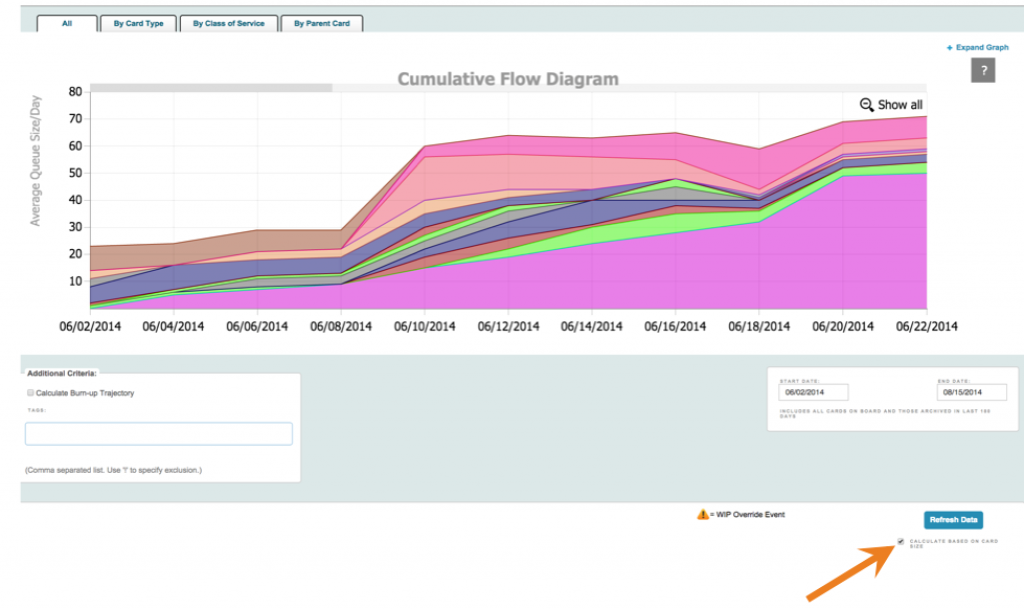
A report using card size as a measure
Bottom line: Limiting your WIP by card size and running reports using card size as a variable gives you better insights to understand where bottlenecks are occurring and how to improve your flow of work.
ACTIVITY
Review cards on a board and discuss as a team whether S-M-L sizing works best for your team or if you want to try more granular size indications, like points.
Work in Progress (WIP) Limits: Improve the Flow
Work-in-progress (WIP) can be defined as all of the tasks you’re working on right now. Limiting WIP helps to focus the team’s attention on shared goals and encourages collaboration. Having less work in progress creates shorter feedback loops within the process and gives more flexibility to learn from how your work is flowing through the process, allowing you to make adjustments on the fly. In practice, combining point sizing and work in progress limits is how you track capacity and demand in the Team Kanban module.
By using WIP limits, you can improve the flow of work through the process steps you’ve defined on your board.
WIP limits keep the work moving without just finding work to stay busy. Focus on moving important work to completion, not just staying busy. Limiting WIP based on capacity (a pull system) can help work flow smoothly through the board at an optimal rate. Pushing large amounts of work into the system clogs it up and slows everything down (and often makes for poor quality, too).
TIP
You can brainstorm your team's process so that team members feel a sense of ownership in their boards and have a process that matches how they work.
There are a lot of options for setting up WIP limits. WIP limits can be established for lanes, including sublanes and swimlanes, and for board users. To learn more about how to set up WIP limits, read here.
Here is an example: Maybe one team member is severely overworked, while another doesn’t have enough work to fill his or her day. This is easy to spot if you assign points to cards and use WIP limits. In this instance, a manager would help to delegate tasks to team members who have more bandwidth, alleviating the pressure from the overworked individual and removing the impediment for the entire team. Combining card sizing with WIP limits make it easy to see when someone has picked up more work than they can handle.
Lane WIP Limits
WIP limits can be placed on lanes, sublanes, and swimlanes within a board. These highlight the lanes with work items that exceed the specified limit.
This is accomplished by assigning points to cards (demand), and then setting the level that indicates the acceptable amount of demand (points) in a lane. When there are more points than the limit you have exceeded your capacity and the issues are highlighted on the board.
Click to learn more about Lane WIP Limits.

Lane WIP limit example
WIP Limits by Card Size
Since card size helps to identify the estimated effort of work, basing WIP on card size helps to identify when the estimated effort associated with work in process overloads the system. Click to configure WIP Limits by Card Size.
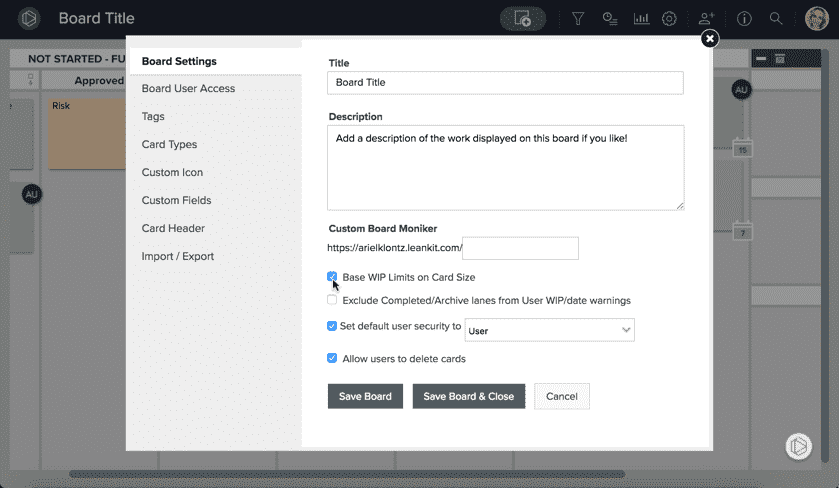
Configure board settings to base WIP limits on card size
User WIP Limits
In the Kanban module, you can set WIP limits on users within a board to limit the number of cards that can be assigned to that user. This can be helpful in ensuring that an individual is not assigned too many work items at any given time. Click to learn how to configure User WIP Limits.
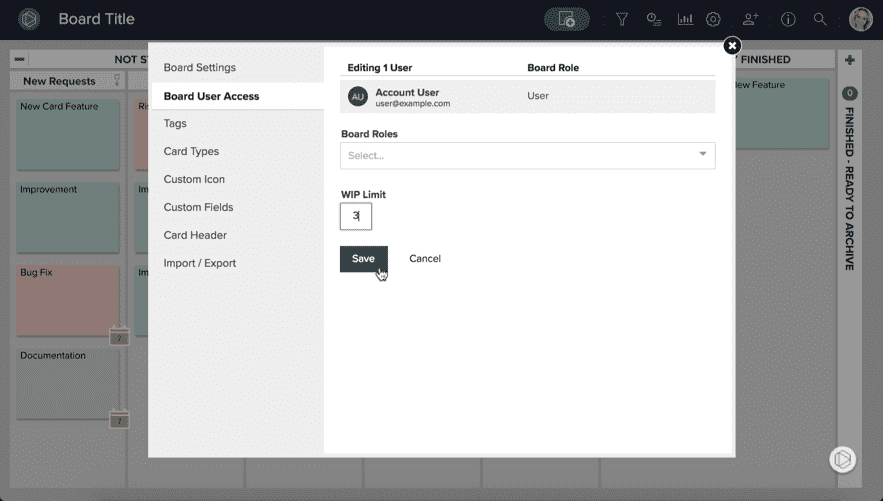
Set WIP limit for a user
TIP
Many Kanban teams have acquired a “no-estimate” reputation. Once you see that asking people to estimate how much time something will take makes up only a small percentage of how long it takes to realistically complete the work, many people feel the freedom to stop estimating small- to medium-sized tasks and focus instead on improving throughput of the Kanban system.
Bottom line: Limiting work in progress is the primary way to modify your Kanban system to improve the flow of work. Reducing the size and number of queues present in the process will lower overall WIP and tend to make the work flow through more smoothly
ACTIVITY
Get Started! Try this exercise with your team: Take some time to learn about why you need to implement WIP limits, and how they can benefit your team. Then, gather around your Kanban board and spend about 30 minutes doing this exercise. Analyze a couple of cards from your team's "done" lane, and figure out how much time you actually spent on it, not including any "wait" time. Compare this estimate to the time it took to actually complete the cards. How much time were those cards in the queue? Could WIP limits eliminate some of this time?
Reports: Track Flow
Reporting and analytics is becoming an important driver for getting work done faster. The Team Kanban solution includes many out-of-the-box reports that can clearly show where any issues may arise. It provides analytic capabilities to help you measure the performance of your process or value stream. This information is valuable in understanding waste or inefficiencies, identifying bottlenecks, and measuring improvements.
Board Analytics
To view an individual board's analytics:
- Click the chart icon
 in the top menu bar.
 - You can choose from a list of available reports from the menu that appears.
- Click the analytics feature you would like to view.
NOTE
Not all reports will be available in all accounts.
You can choose the analytics that track the productivity data you are most interested in. These reports are commonly used to track time to delivery:
- Speed: Shows the average amount of time that a card takes to be processed from a specified start lane(s) to a specified finish lane. This report is generally used to calculate the amount of time that work items take from the time that they enter the work in progress until they are complete.
- Distribution Diagram: Shows the current distribution of cards with on the board by lane, priority, type, assigned user, or custom icon. These snapshots provide a quick overview of the how work items are distributed within the system and how much of your capacity is dedicated to different types of work.
- Efficiency: Helps you to determine the amount of your in-progress work that is active or inactive over a specific period of time. Using this report can help you understand which lanes or areas of your board may be inefficient. It can also help you to determine where and how to implement lane WIP limits.
- Burndown: Helps teams that have a specific amount of work to complete in a specific period of time visualize their progress and answer the question, “Are we on track to complete the planned work by the deadline/end of this iteration/sprint?" It also helps to understand the impact of unplanned work.
- Exceptions: Can help team leaders know when to intervene to keep their team’s work on track. The report also helps teams better identify problems and make room for improvement.
- Flow: Shows the relative amount of work in progress for each lane over time. Variations in the width of the colored bands in the chart indicate either more or less work in that lane over time. Widening bands often represent bottleneck situations. The amount of work in process is also a good predictor of the remaining cycle time.
- Timeline: Allows you and your team to easily view scheduled work items within your board. The report displays work items spanning from their planned start to their planned finish dates or from their actual start to their actual finish dates.
Board Statistics
You can also learn a lot about how quickly work is being accomplished by viewing statistics on your boards. The board health panel, which appears when you click  , graphically displays your bottlenecks, how many cards you process per week, and card throughput, which is how many cards were started versus how many cards were finished.
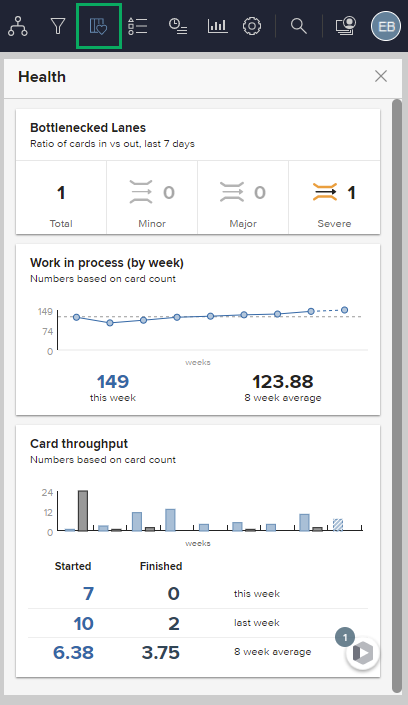
Board statistics example
ACTIVITY
Review analytics and statistics for one of your boards and see which work best for your team. Do you need to make any adjustments to your board to improve your data?
Backlog/Pull System: Only Start Work When You Are Ready to Go
Using Kanban helps teams switch from “push” to “pull” systems. A push system is what happens naturally in teams: One person completes their part of a piece of work, and then “pushes” it to the next person without regard for their capacity. You might have heard this referred to as “throwing (a piece of work) over a wall.”
The problem with operating in a push system is that it doesn’t encourage teams to actually operate as a system. Instead, individuals operate in functional silos—performing their functions as opposed to collaborating cross-functionally, leading to miscommunications, frustration, and resentment. It’s especially easy to operate in a push system when work is not visualized, because issues like bottlenecks aren’t easily recognized.
Instead of person A pushing work over a wall to person B, person A and person B work together to decide when to start that work. When the system has capacity for that project to begin, person A performs their part, then when they are ready, person B pulls it onto their plate. For more on this, see Kanban System: Maximize Time and Improve Efficiency. In the following example, when someone on the Validating team puts the card into the Ready column, someone from the Deploying team can pull it into the In Progress column.
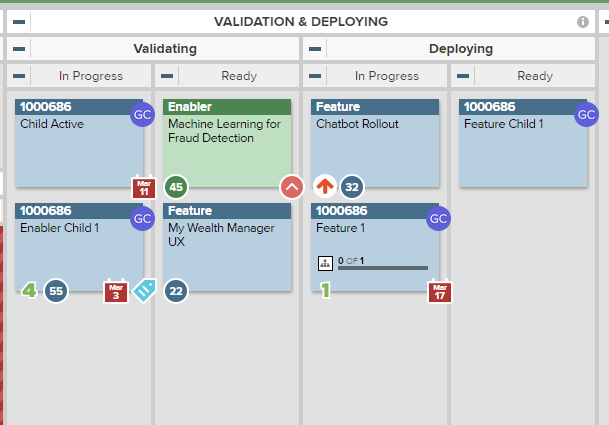
The pull system
The following example shows the backlog system. All work that is not started stays in the backlog column. The team only pulls new work in when they are ready to start it. If work moves between two groups, make sure there is a done column on the board, so the work can rest there until the second group is actually ready to begin. You can also use @mentions in a comment to let the second group know the work is ready when they are.
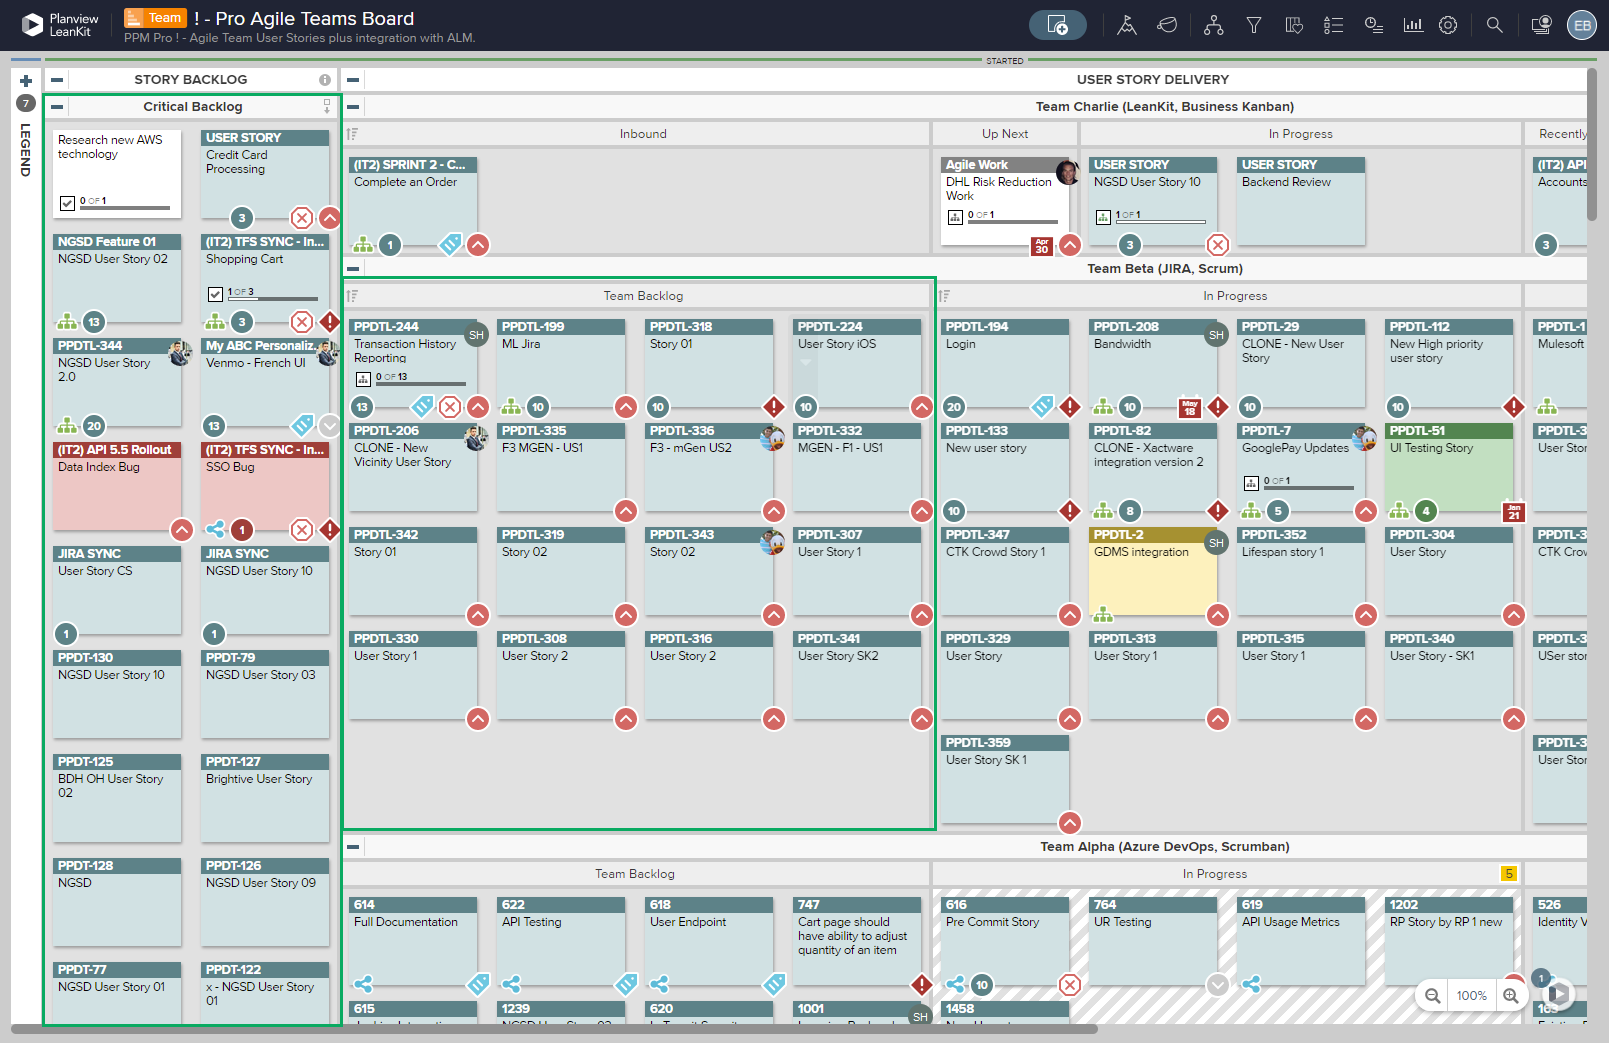
This team uses two types of backlogs to store work until there is capacity to start it
Bottom line? The Team Kanban module encourages good Agile practices by supporting the backlog/pull approach to capacity and demand. The visual nature of boards (especially when used with appropriate templates) helps clarify the importance of only pulling in work from the backlog when it's time to do the work.
ACTIVITY
Review your boards current backlog and finished lanes, and brainstorm ways to make them more effective and accurately represent your workflow.