
Manage Deployment – KPIs Dashboard
Deployment KPIs Dashboard allows users to track key metrics across Deployment Plans.
Ask Plutora’s Support to make the Deployment KPIs Dashboard appear in your navigation menu.

Location
To locate the Deployment KPIs Dashboard:
- Request Plutora Support to add Deployment KPIs Dashboard to your navigation menu.
- Go to Deployment > Deployment KPIs.
Layout
The Deployment KPIs Dashboard displays the following:
- Date Filters:

- Set the start date (left) and end date (right).
- Other Filters:
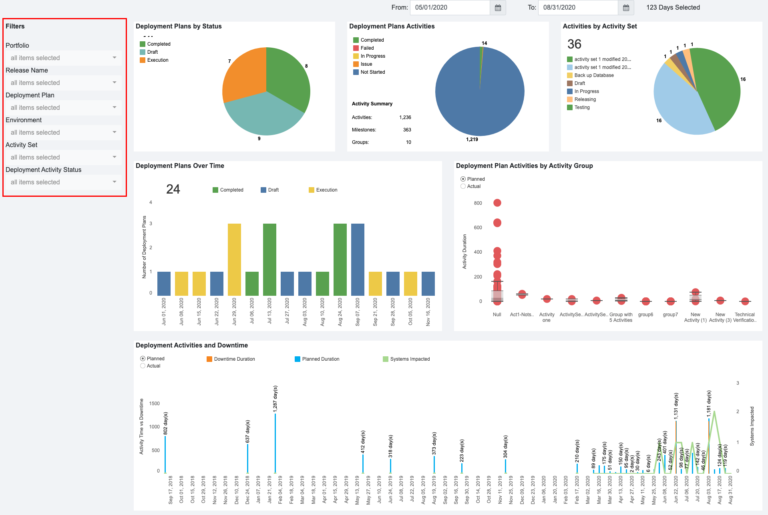
- The left sidebar of the Deployment KPIs Dashboard allows the user to filter the data in the rest of the dashboard by:
- Portfolio:
- Select by Portfolio Association.
- Release Name:
- Select by Release Name.
- Deployment Plan:
- Select by Deployment Plan.
- Environment:
- Select by Environment.
- Activity Set:
- Select by Deployment Plan Activity Set.
- Deployment Activity Status:
- Select by Deployment Activity Status.
- Portfolio:
- The left sidebar of the Deployment KPIs Dashboard allows the user to filter the data in the rest of the dashboard by:
- Widgets:

- Each widget shows a different KPI, including:
- Deployment Plans by Status:
- Statuses (or Modes) are Completed, Draft, Approved, and Execution.
- Deployment Plans Activities:
- Deployment Plan Activities statuses are Not Started, In Progress, Issue, Failed, and Completed.
- Groups are Activity Groups.
- Activities by Activity Set:
- The Activity Sets from all filtered Master Deployment Plans.
- This widget will be empty if there are no filtered Master Deployment Plans.
- Deployment Plans Over Time:
- Deployment Plans with Activities that have a duration falling within the selected dates.
- The Deployment Plan Status (or Mode) is displayed by color.
- Click + or – to see the data daily, weekly, monthly, quarterly, or yearly.
- Deployment Plan Activities by Activity Group:
- A box and whisker plot showing Deployment Plan Activities with a duration that falls within the selected dates, organized by Activity Group.
- The data is displayed as:
- Upper Whisker: The upper extreme of the data.
- Upper Hinge (top box): The upper quartile or Q1.
- Median (the line between the boxes): Data median.
- Lower Hinge (lower box): The lower quartile or Q3.
- Lower Whisker: The lower extreme of the data.
- Deployment Plan Activities that lack an Activity Group are placed in the Null group.
- Filter by the widget radio buttons:
- Planned: Planned deployment dates.
- Actual: Actual deployment dates once the Activities are completed.
- Deployment Activities and Downtime:
- Deployment Plan Activity Downtimes.
- Filter by the widget radio buttons:
- Planned: Planned deployment dates.
- Actual: Actual deployment dates once the Activities are completed.
- The right-hand Y axis and green line show the number of Systems associated with the filtered Deployment Plans.
- Click + or – to see the data daily, weekly, monthly, quarterly, or yearly.
- Deployment Plans by Status:
- Click on the sections of each widget graph to display a breakdown of the data in that section. Click again to display all the data.

- Each widget shows a different KPI, including:
