Reports Cookbook
The purpose of this topic is to provide an example set of reports and steps to configure them (recipes), so that you can get a feel for what's possible and also reverse-engineer various report types and topics. A report definition file is also included with each recipe, which you can use to directly upload the report into PPM Pro and start working.
While many of these reports reference a project or portfolio or other entity, they can often be modified for other entity levels. If you have any questions about any of the following or other reporting needs not addressed here, are looking for a specific recipe that has not yet been included, or have a recipe you would like to share, please contact productmanagement-ppmpro@planview.com.
Report Recipes
| # | Type | Sample Visualization | Report |
|---|---|---|---|
| 1 | Pie: Basic | 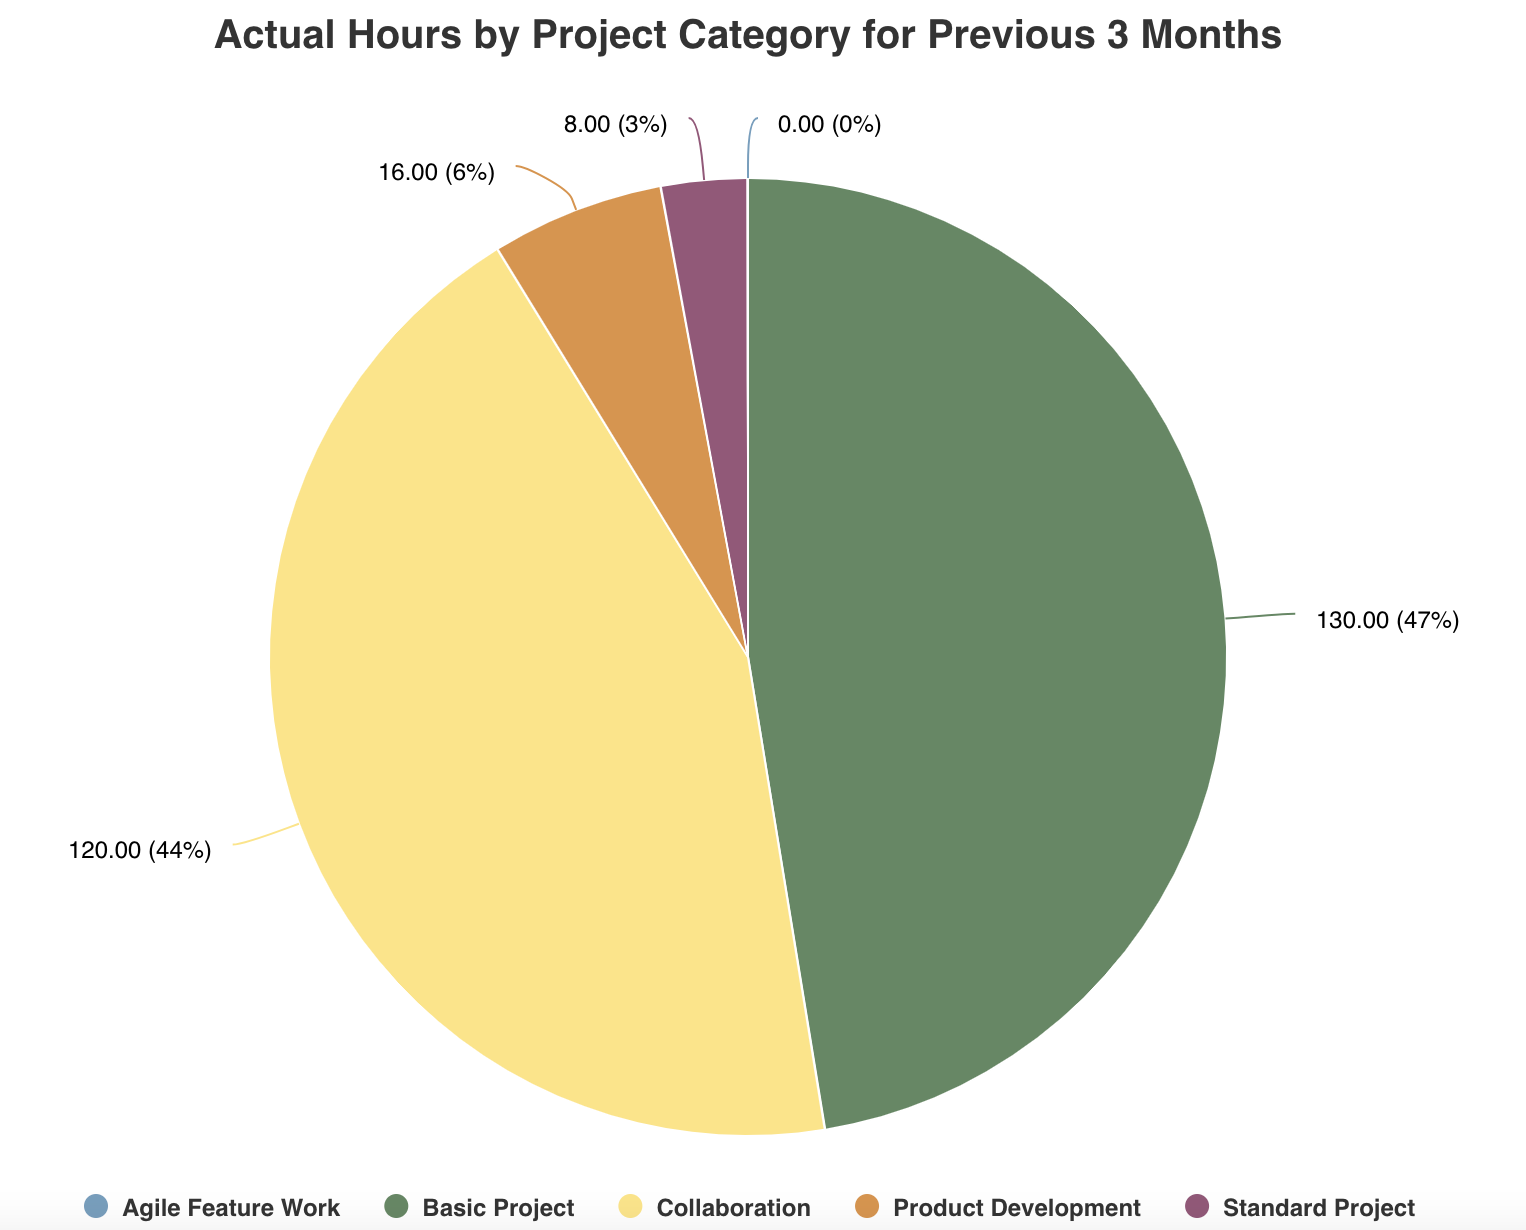 |
Actual Hours by Project Category for Past 3 Months - Displays the total actual hours recorded over the past 3 months and broken out by project category |
| 2 | Pie: Basic | 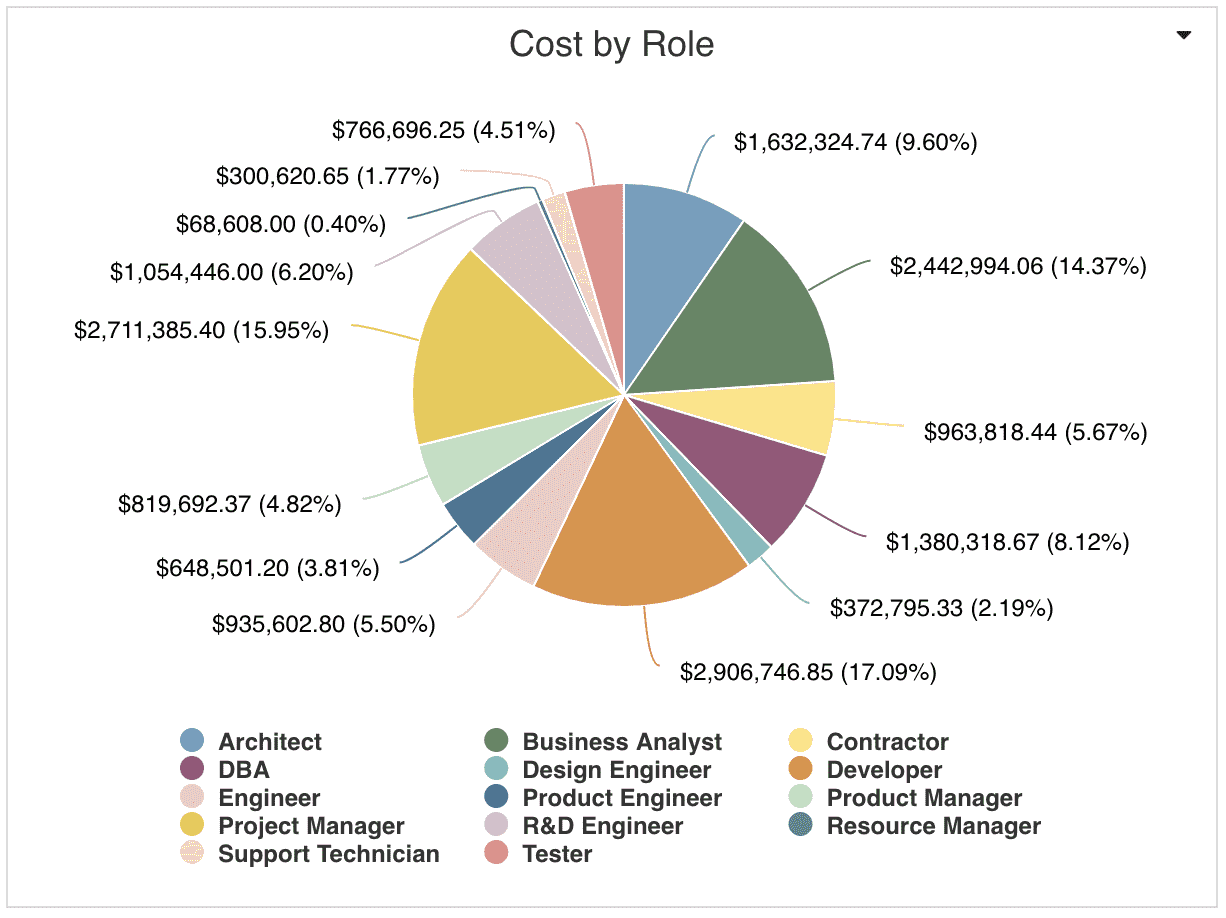 |
Allocated Cost by Role - See the total allocated cost for each role |
| 3 | Pie: Basic | 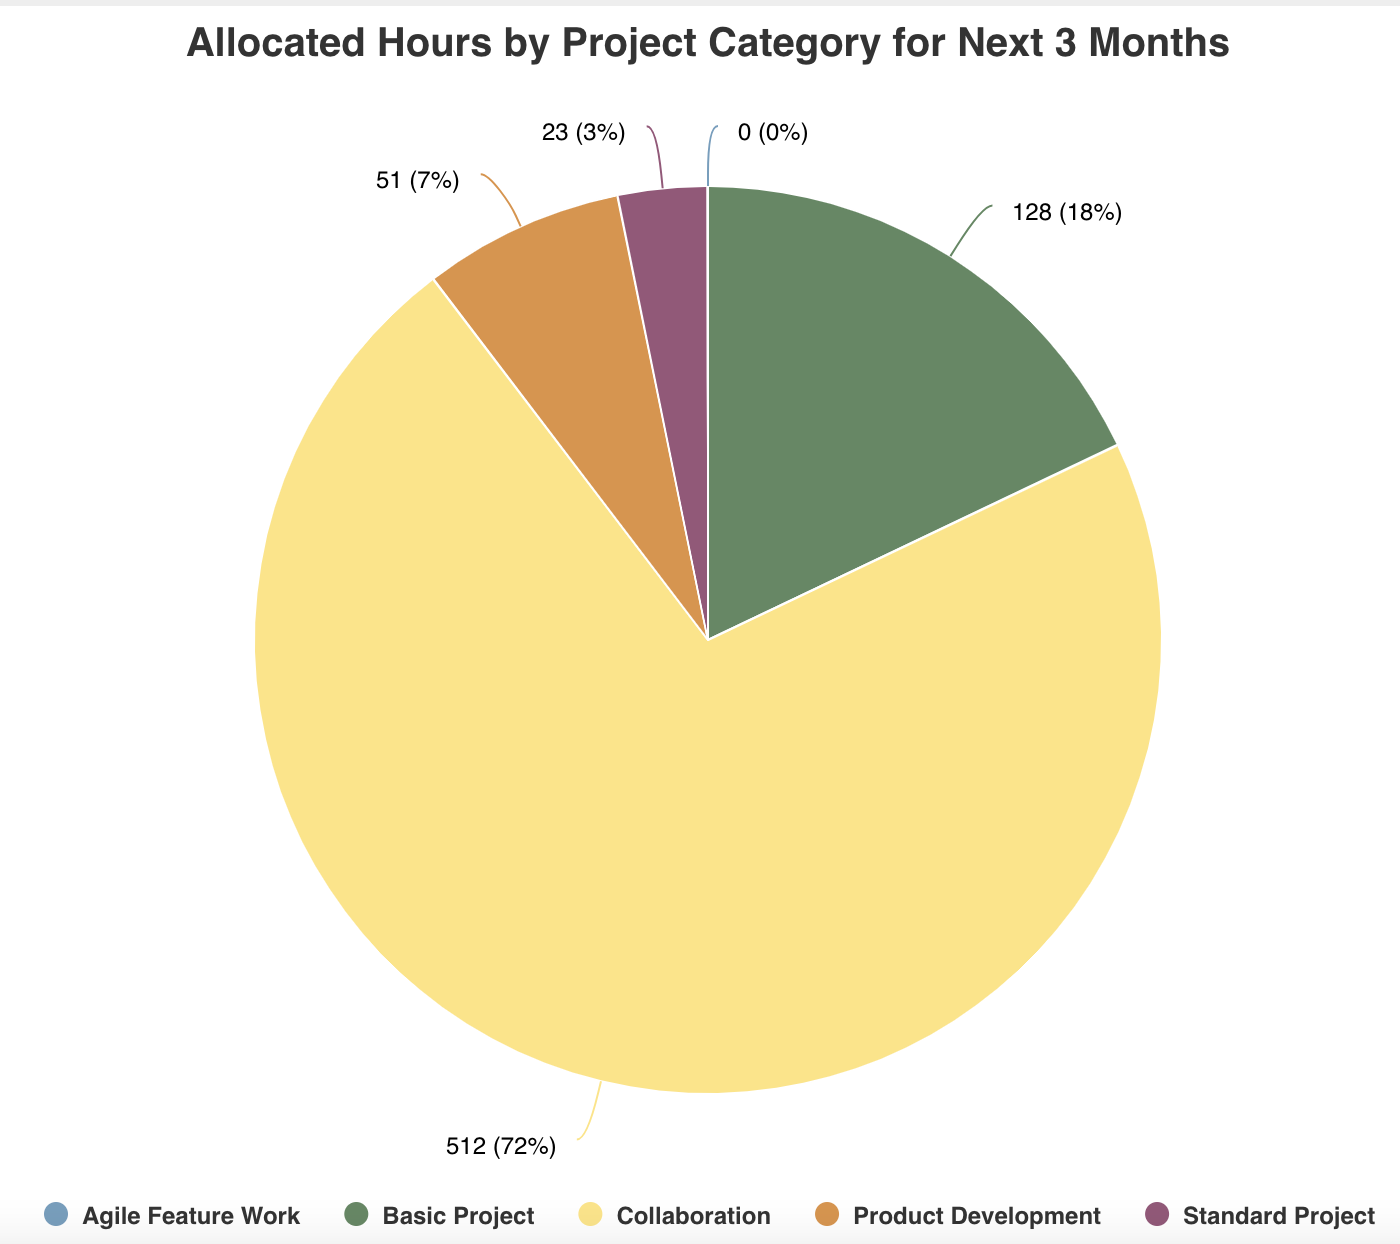 |
Allocated Hours by Project Category for Next 3 Months - Displays the total allocated hours to project over the next 3 months and broken out by project category |
| 4 | Bar: Basic |  |
Allocated Hours by Projects - See all allocated hours across a set of projects |
| 5 | Bar: Basic |  |
Applications by DBMS - Shows the number of applications broken out by database management system |
| 6 | List: Time Series | 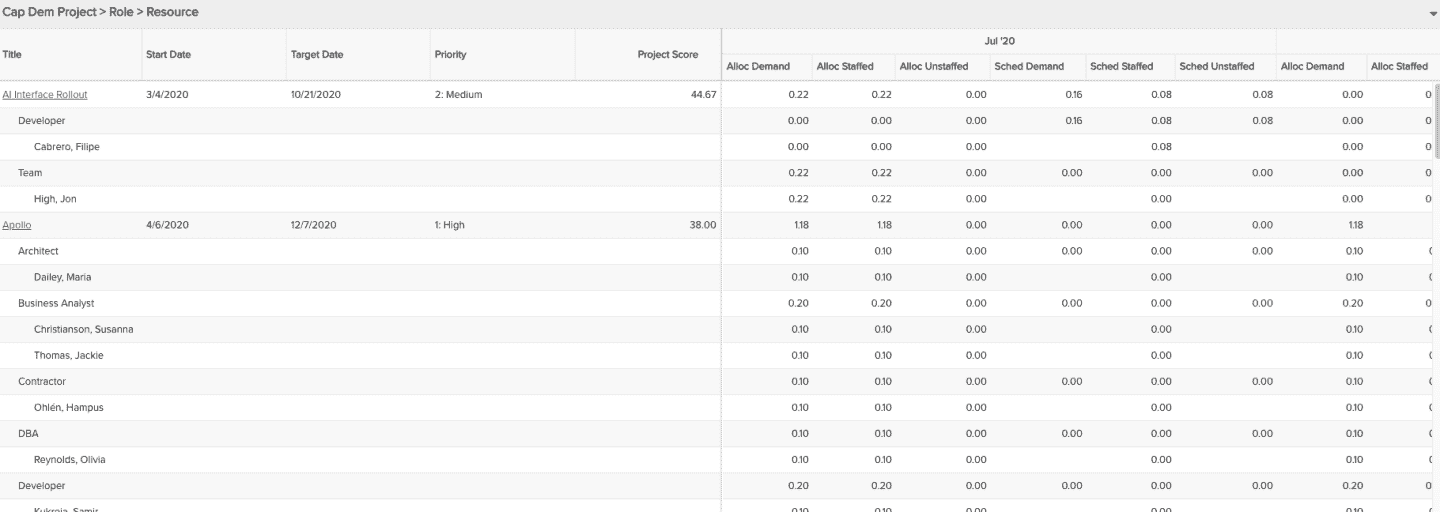 |
Capacity and Demand: Project-Role-Resource - Shows a capacity and demand report with levels of project, role, and resource, for allocated hours/FTE (demand, staffed, unstaffed) and scheduled hours/FTE (demand, staffed, unstaffed) |
| 7 | List: Time Series | 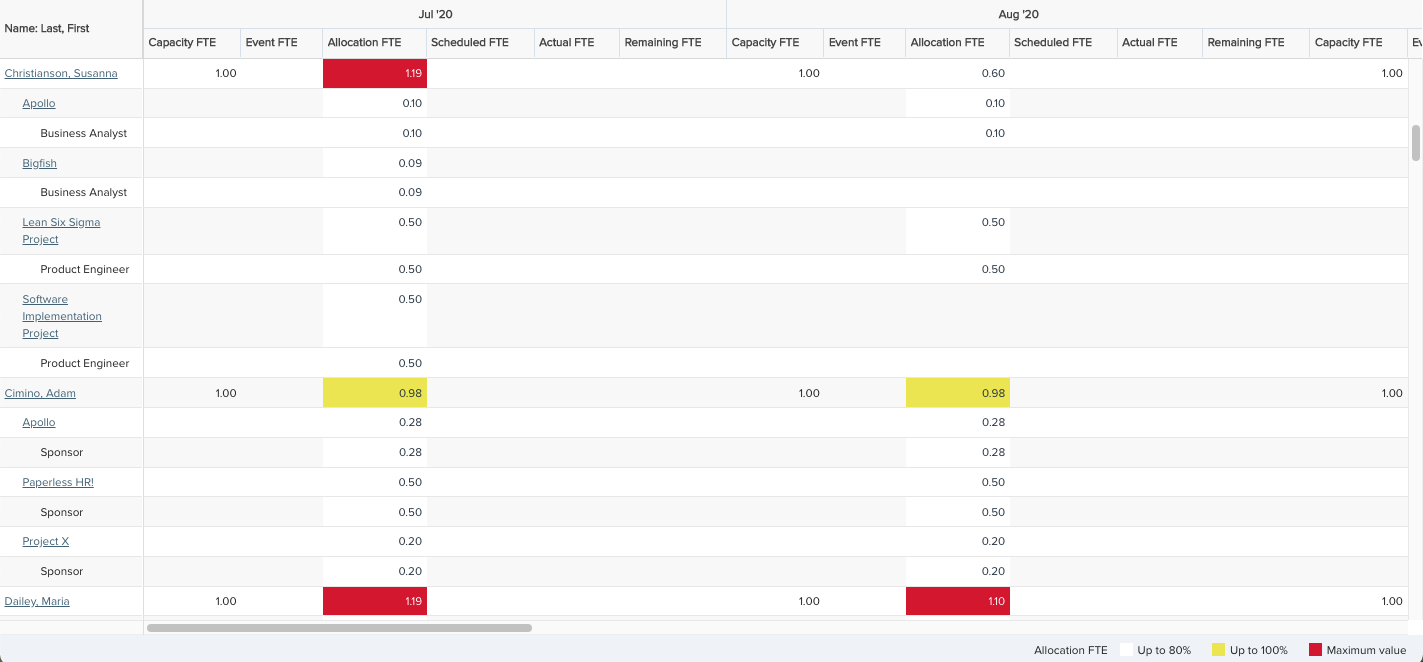 |
Capacity and Demand: Resource-Project-Role - Shows a capacity and demand report with levels of resource, project, and role, for capacity, event, allocated, and scheduled hours/FTE |
| 8 | List: Time Series | 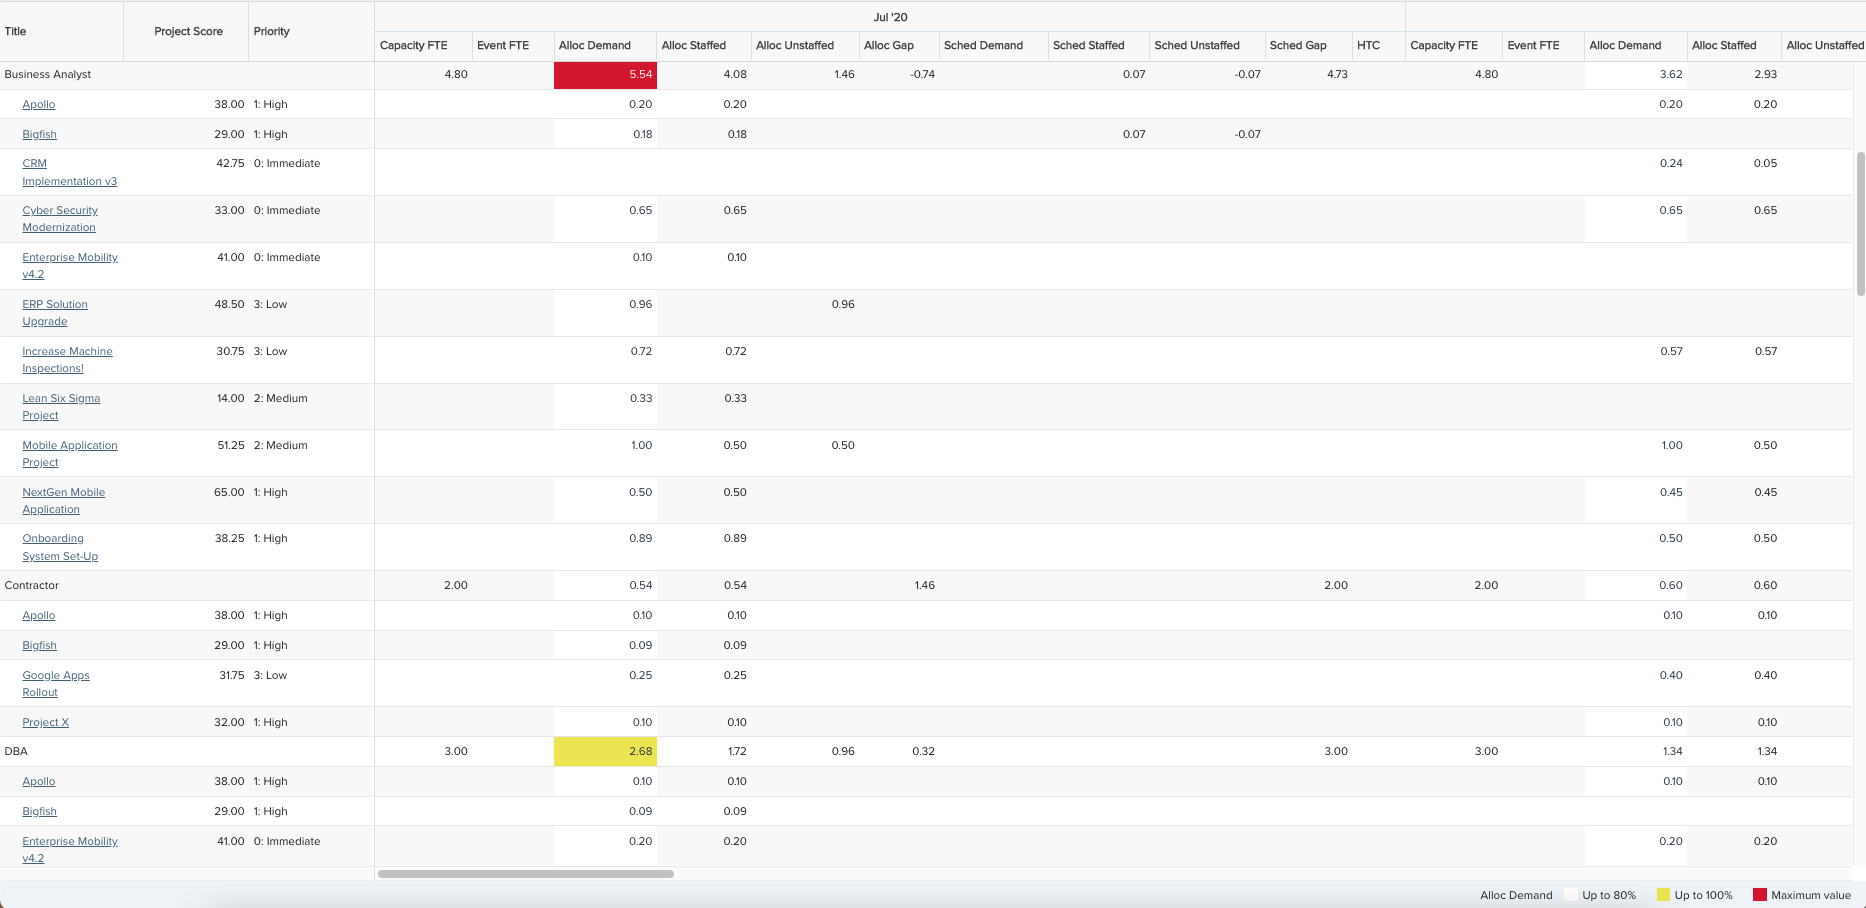 |
Capacity and Demand: Role-Project - Shows a capacity and demand report with levels of role and project, for capacity, event, allocated (demand, staffed, unstaffed) hours/FTE, scheduled (demand, staffed, unstaffed) hours/FTE, and remaining HTC |
| 9 | Combination: Stacked Area, Stacked Column, Line |  |
Capacity vs. Project Allocations vs. Timesheet Hours - Compares staffed project hours, optionally broken out by proposed and active projects, versus timesheet hours and capacity hours |
| 10 | Line | 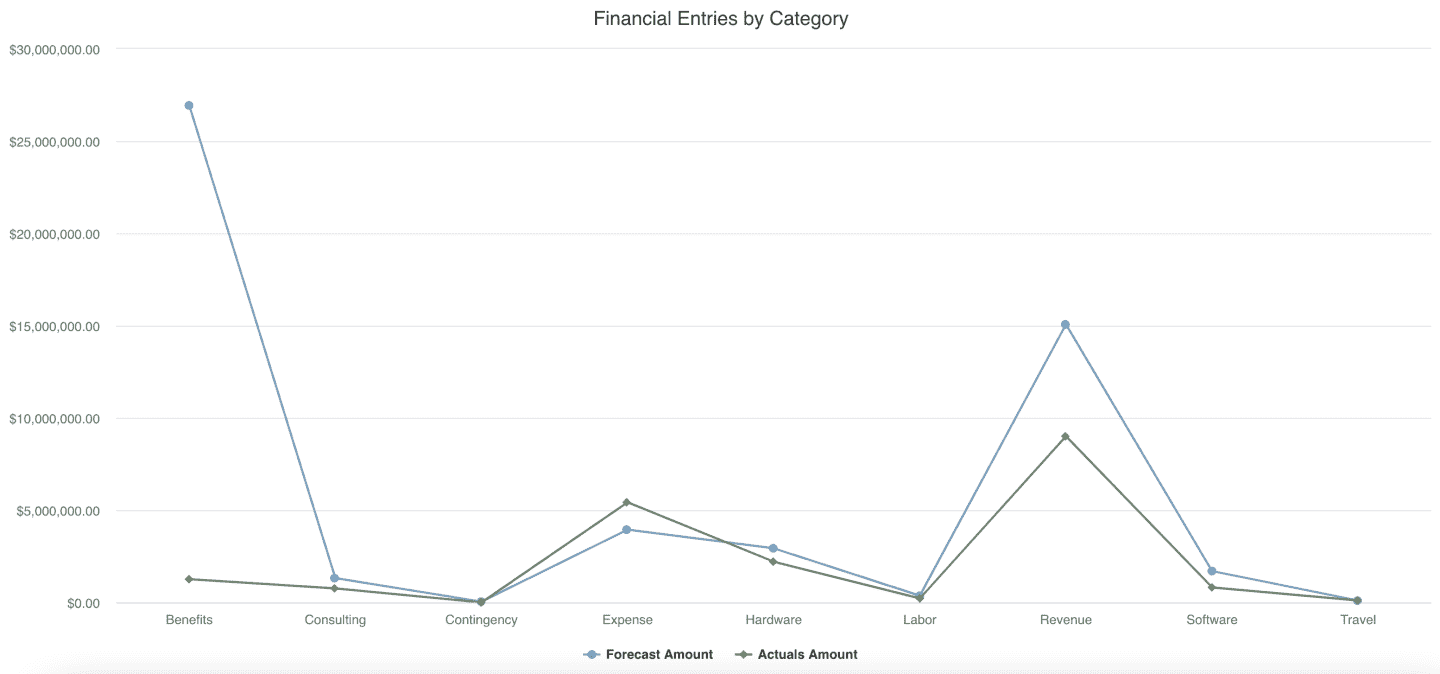 |
Financial Entries by Category - Compare forecasts to actuals by category across projects |
| 11 | List: Time Series | 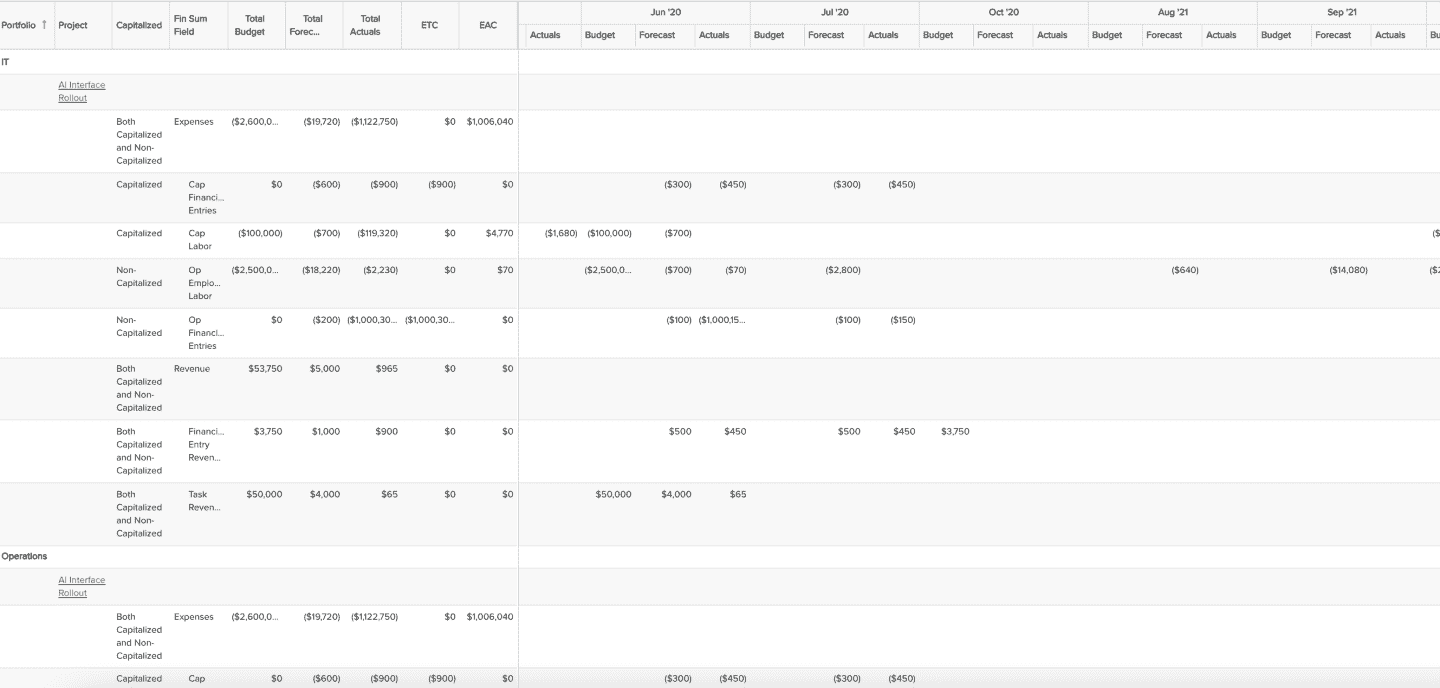 |
Financial Summary Full Structure - Displays project financial summary structures with budgets, forecasts, and actuals over time, for entire financial summary hierarchy/all levels |
| 12 | List: Time Series | 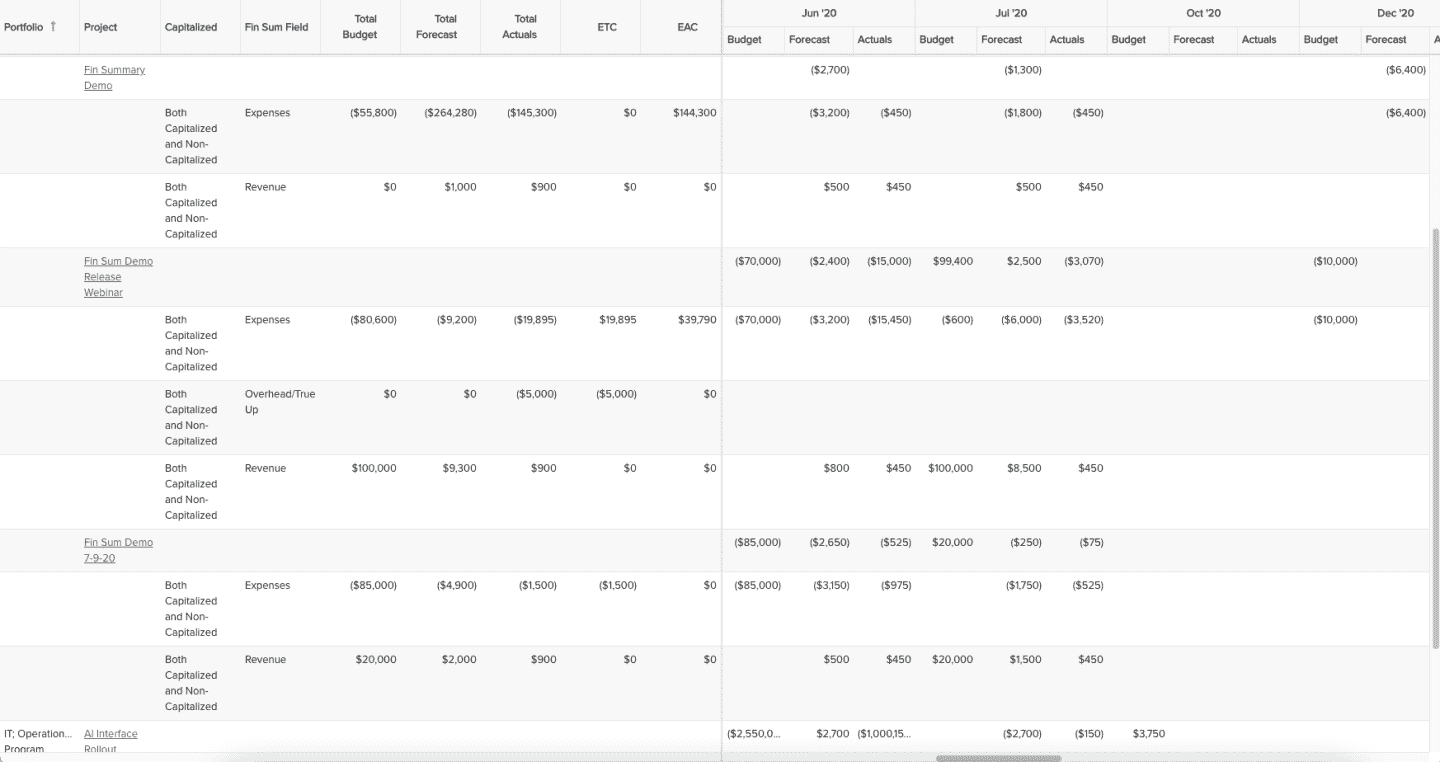 |
Financial Summary Top-Level Structure - Displays project financial summary top-level fields only, with budgets, forecasts, and actuals over time |
| 13 | List: Basic | 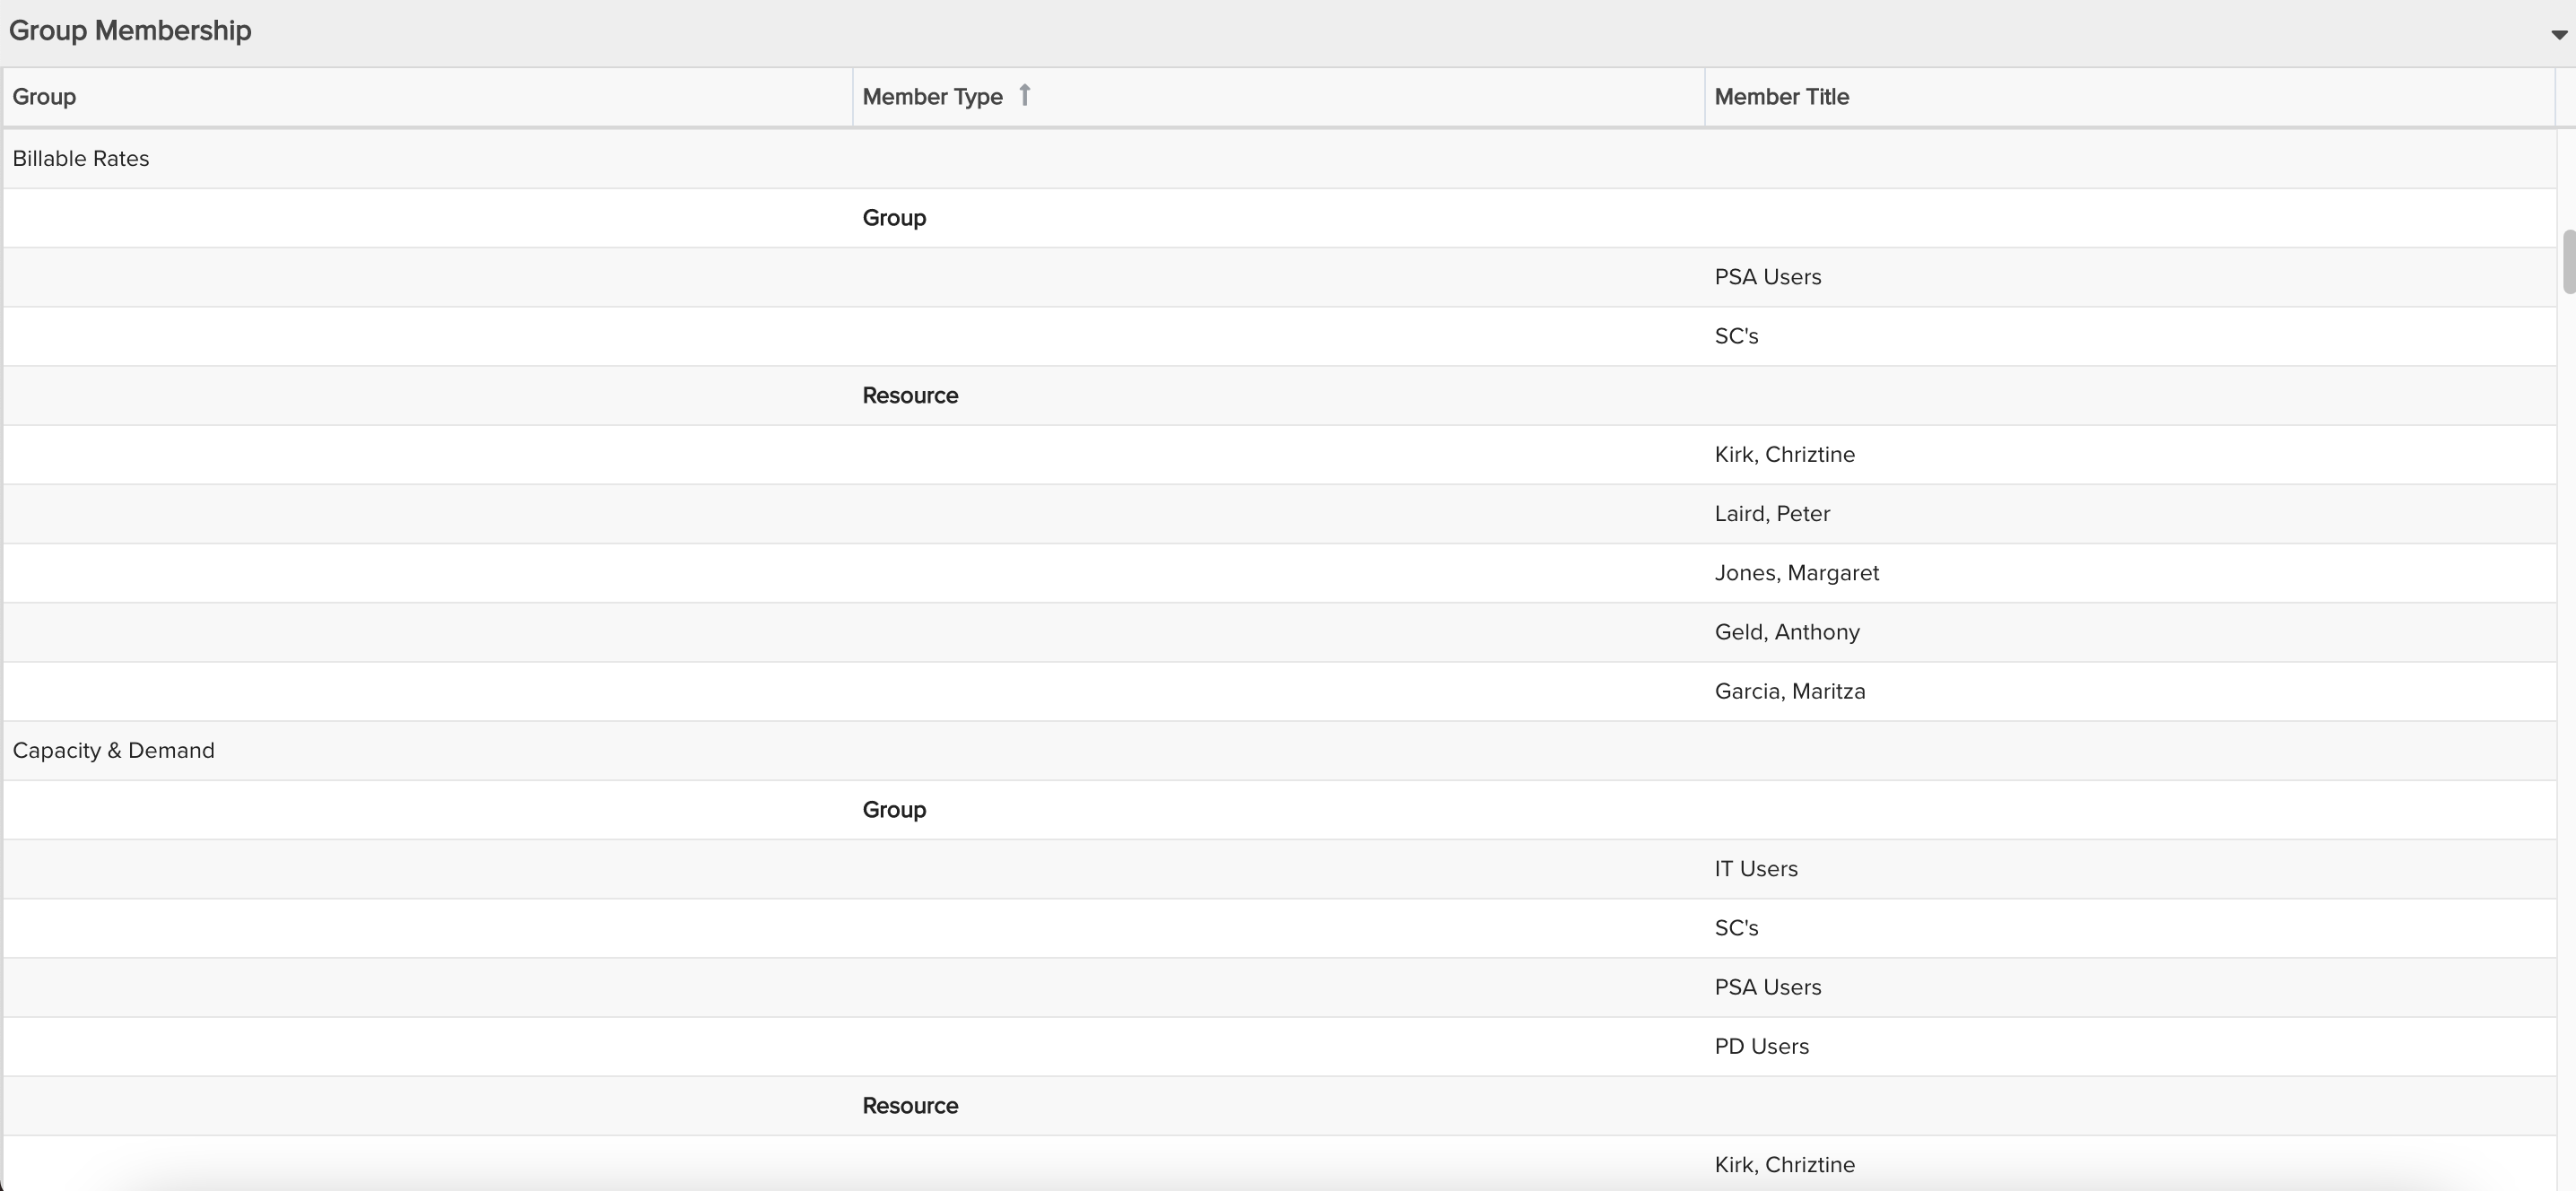 |
Group Membership - Show all groups and their members, including resources, other groups, and units |
| 14 | List: Basic | 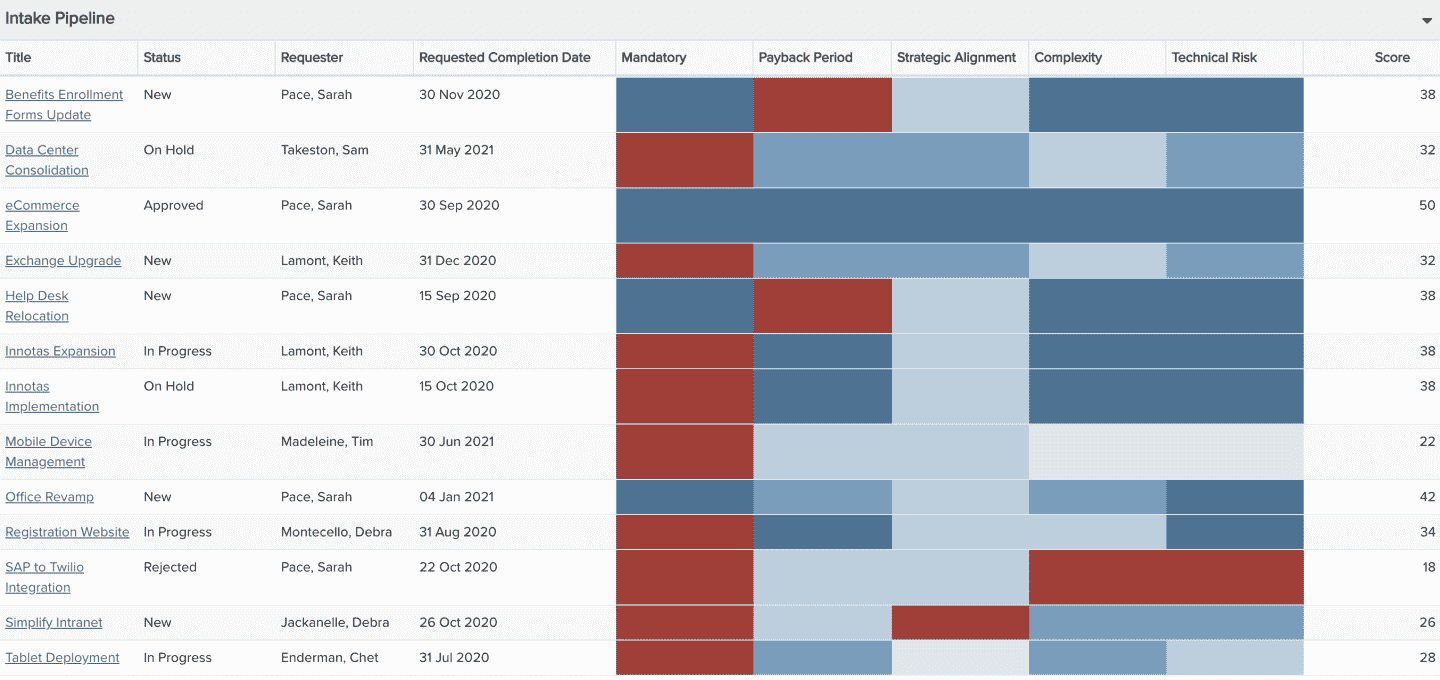 |
Intake Pipeline - Shows a list of requests with key status information |
| 15 | Bubble | 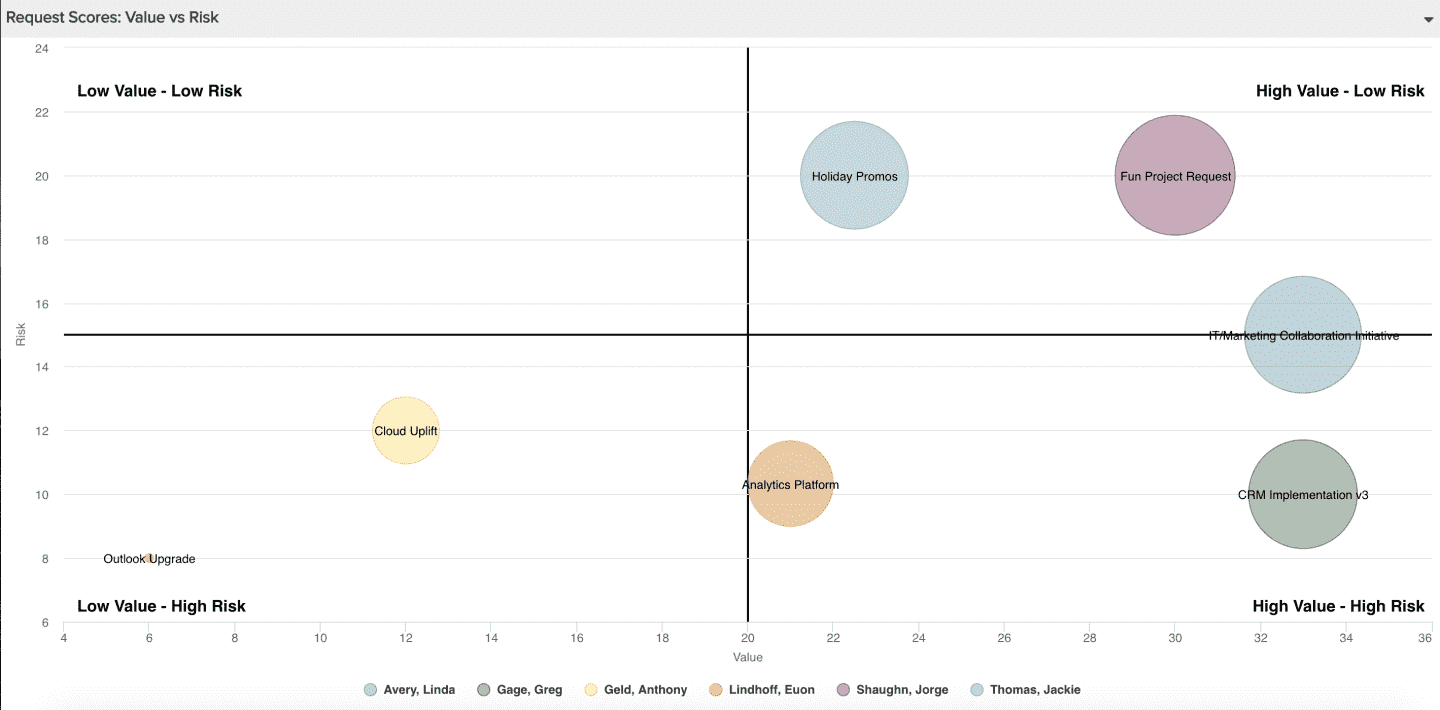 |
Intake Request Risk vs. Value - Shows overall requests score breakdown by Risk and Value |
| 16 | List: Basic | 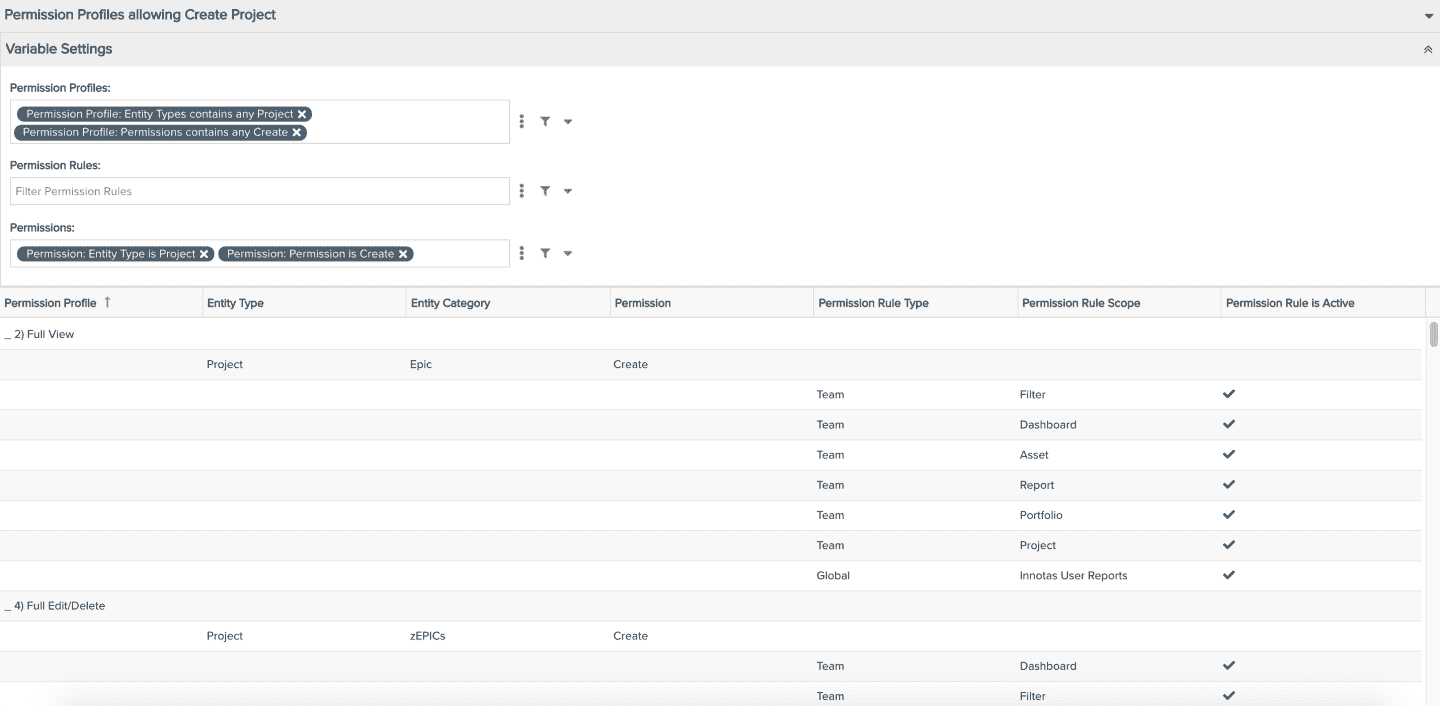 |
Permission Profiles allowing Create Project - Shows which permission profiles grant the ability to create projects (what profiles have what permissions) |
| 17 | Column: Basic | 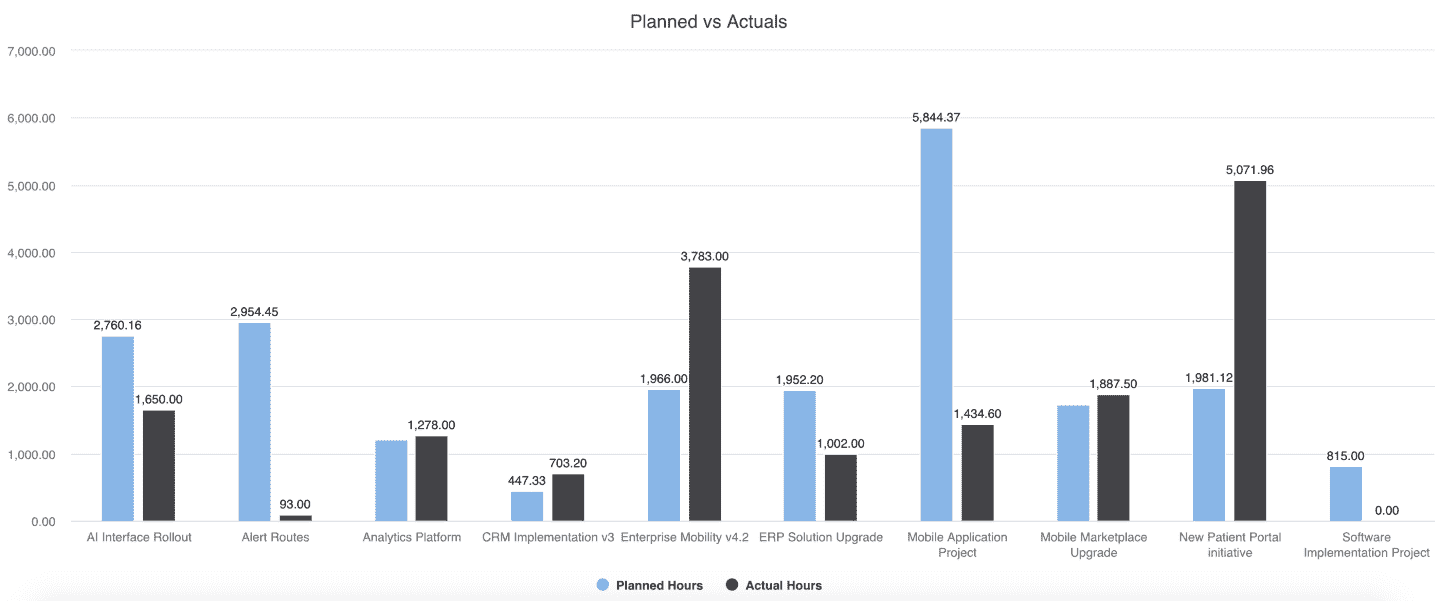 |
Planned vs. Actuals - Compare planned versus actuals data across a set of projects |
| 18 | Combination: Area, Column, Line | 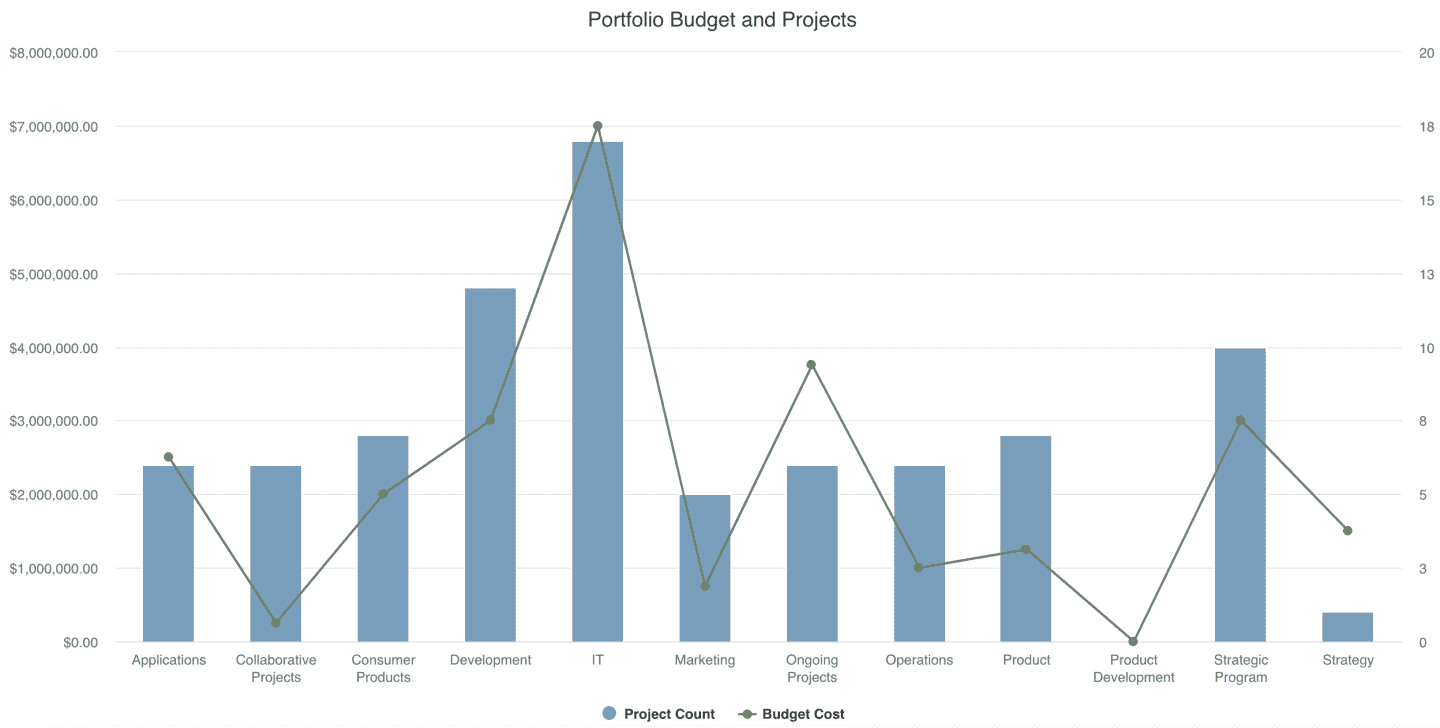 |
Portfolio Budget and Projects - Shows budget broken out by portfolio, overlaid with the number of projects per portfolio |
| 19 | List: Time Series | 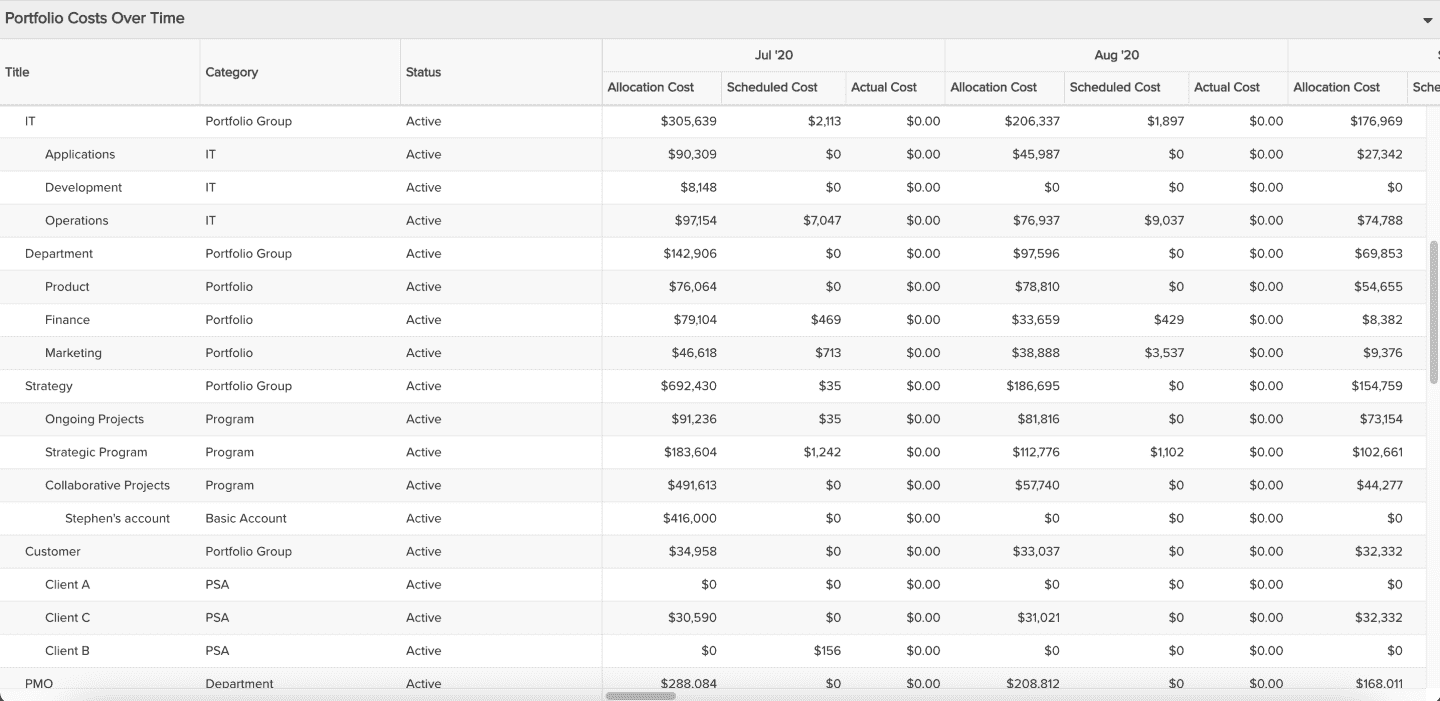 |
Portfolio Costs Over Time - Compares allocated, scheduled, and actual costs over time for portfolios' projects |
| 20 | List: Basic | 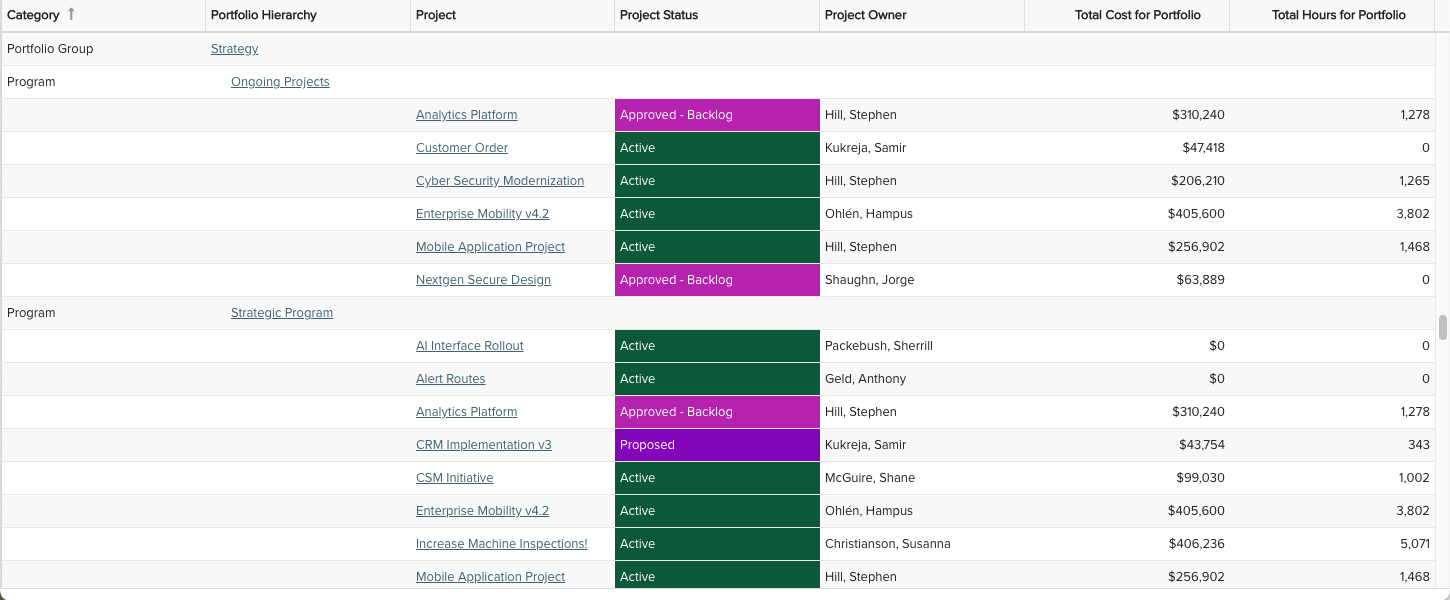 |
Portfolio Hierarchy with Project Details Considering % to Include - Shows by category a portfolio hierarchy with projects linked to each portfolio and details, including numeric values based on the % of the project to include in the portfolio (very useful if you have projects with % to include less than 100% associated to one or more portfolios) |
| 21 | List: Basic | 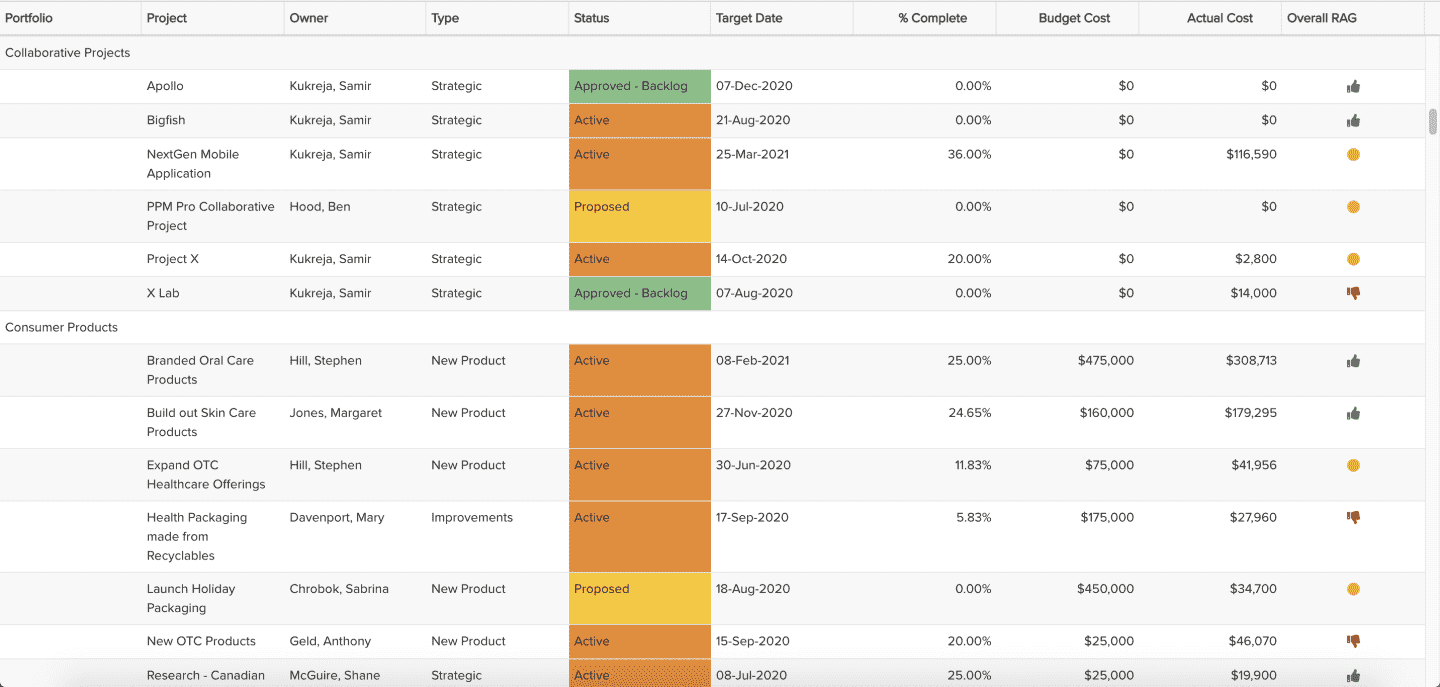 |
Portfolio Project Status - See a portfolio of projects with key status information |
| 22 | Gantt | 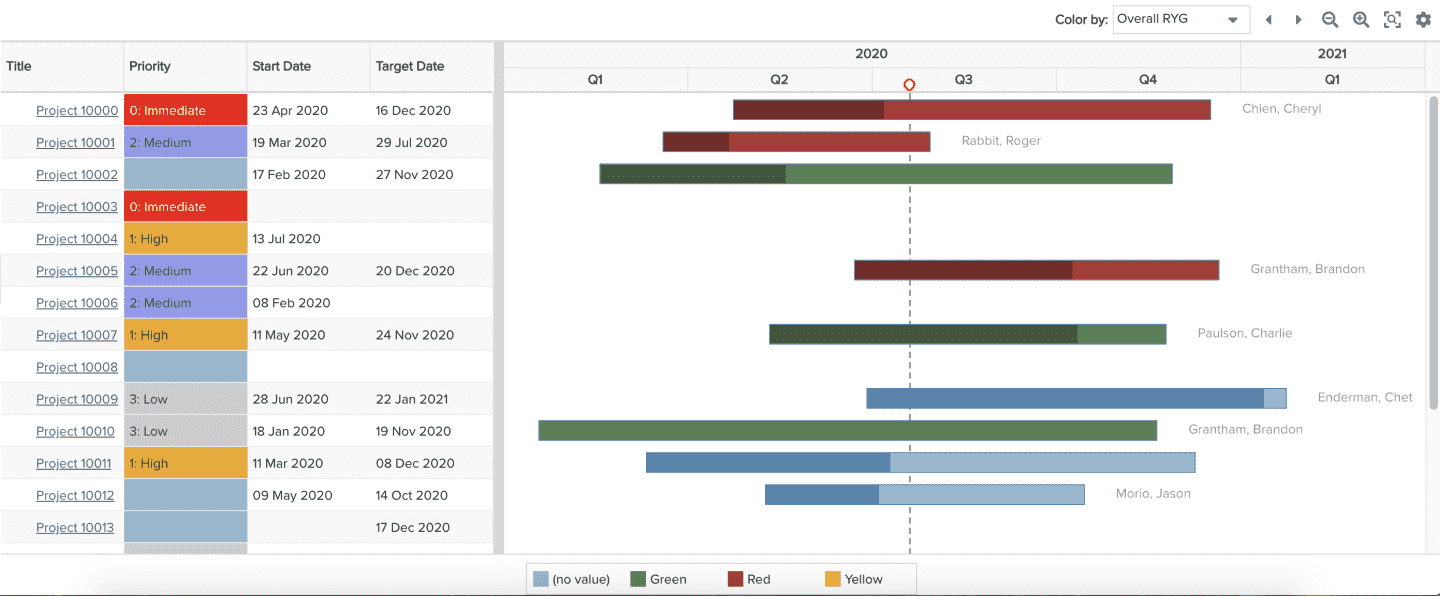 |
Portfolio Roadmap - View the roadmap of a portfolio's projects by start and target date, including key project details |
| 23 | Gauge | 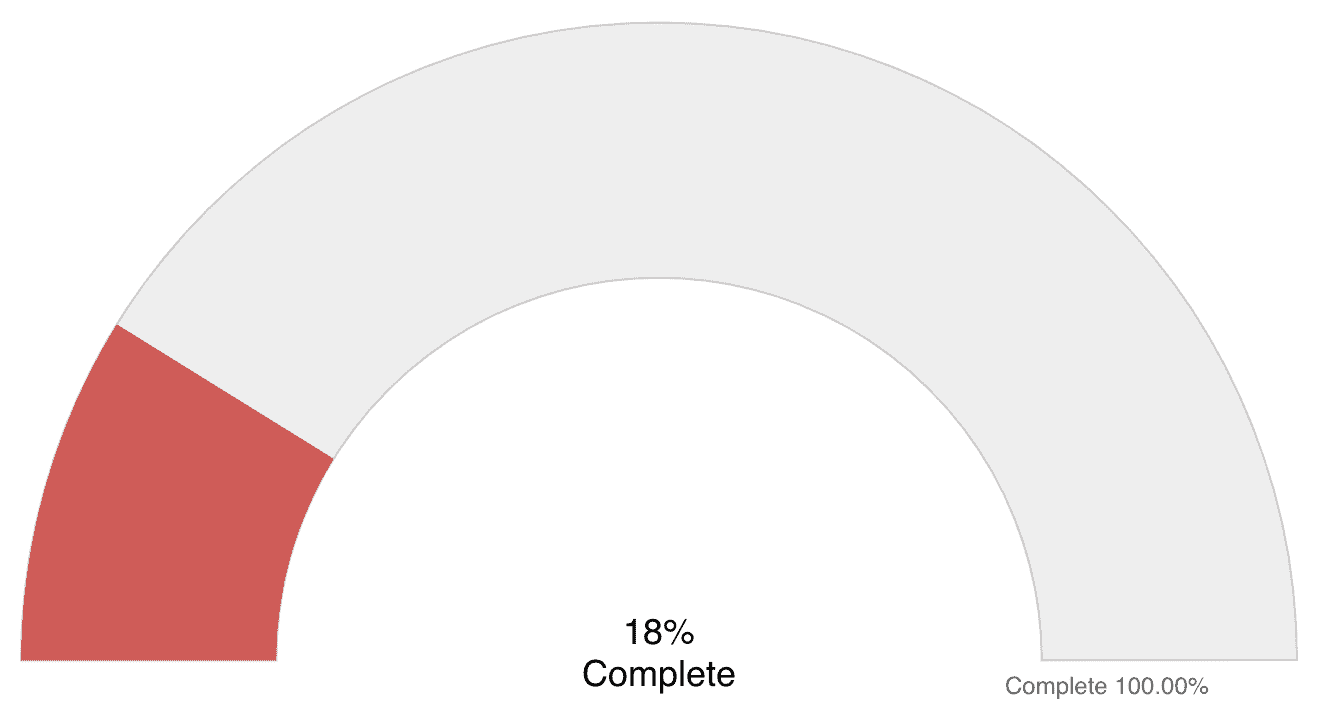 |
Project % Complete - Shows a project's % complete |
| 24 | Gauge | 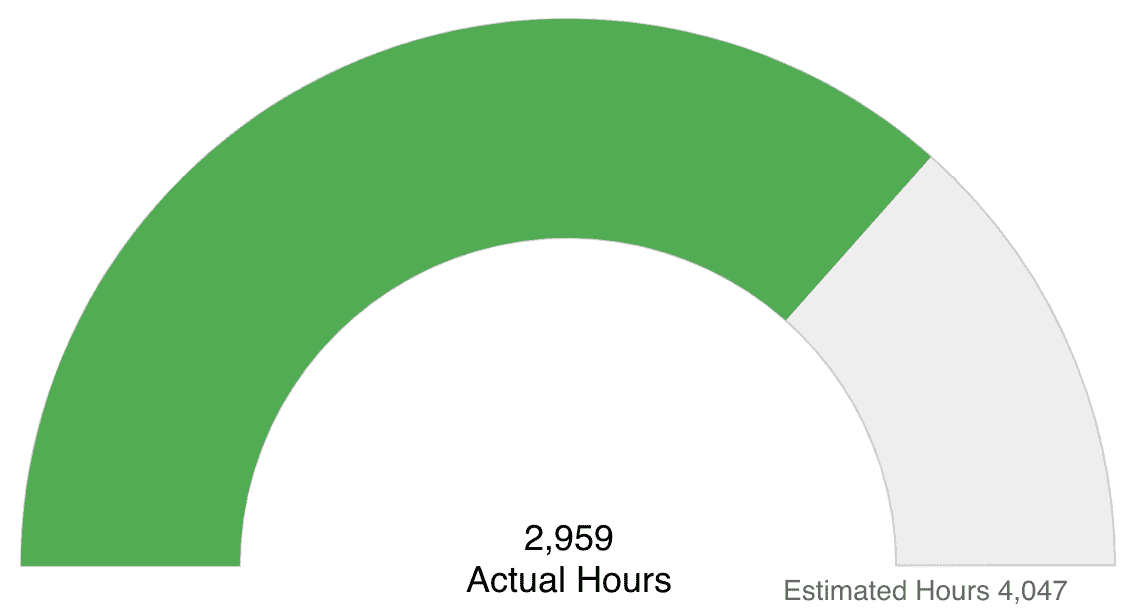 |
Project Actuals vs. Estimated Hours - View the progress of actual hours to estimated hours |
| 25 | List: Basic | 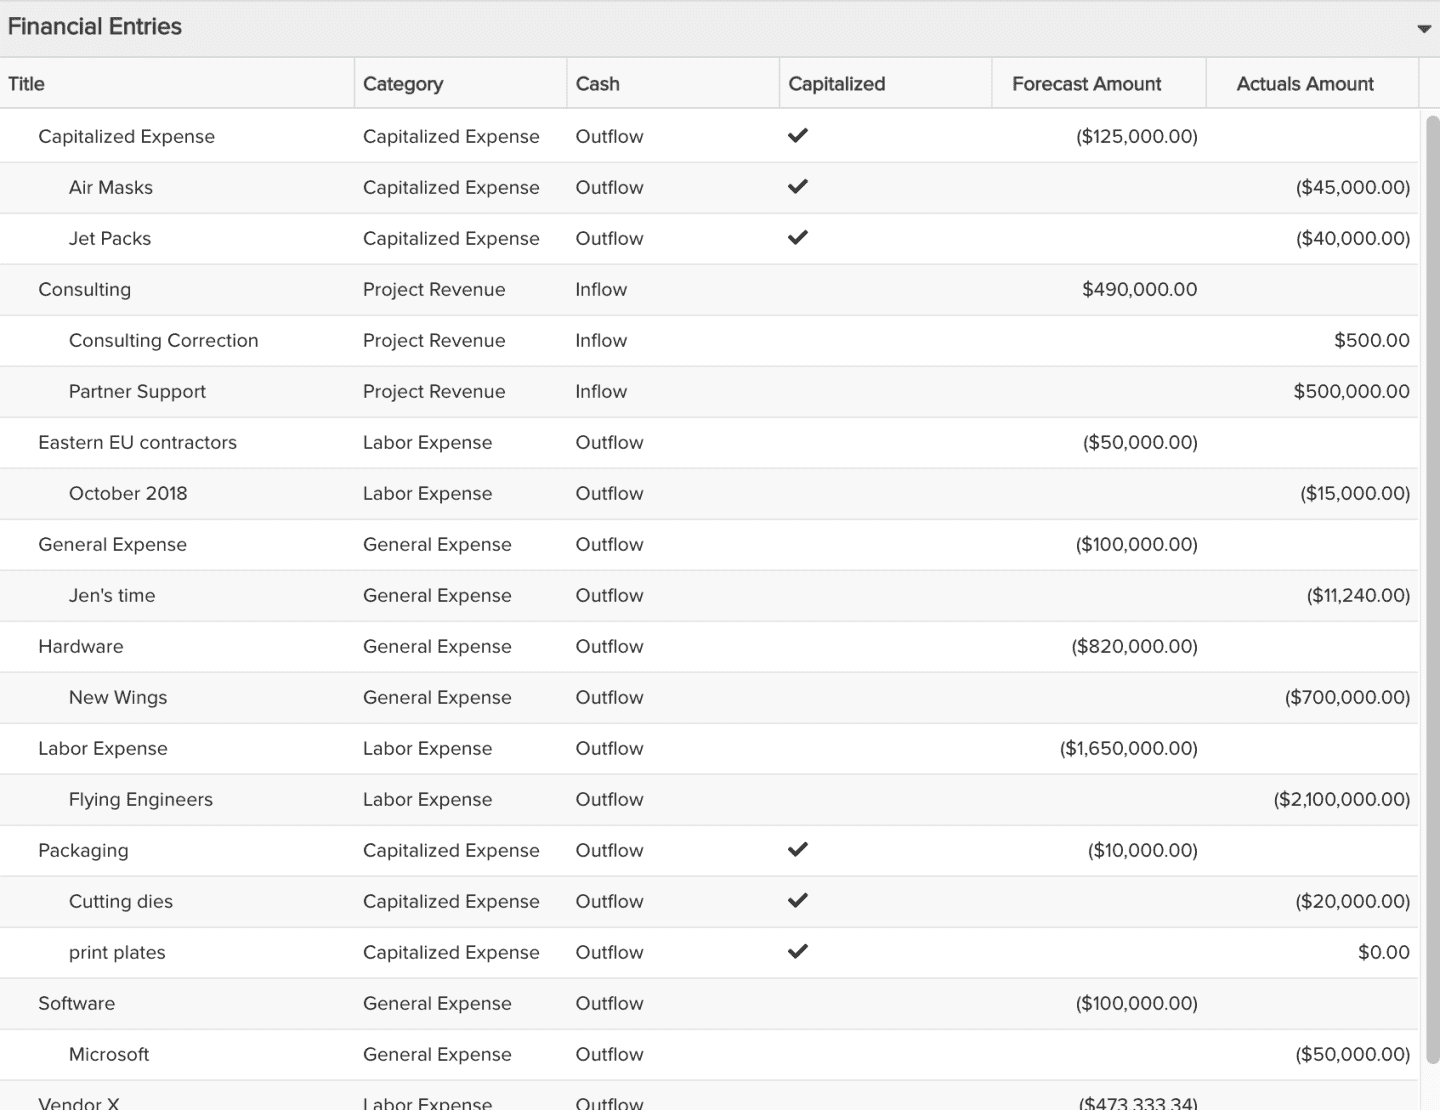 |
Project Financial Entries - Shows all of a project's financial entries, hierarchically by forecast with actuals |
| 26 | Spiderweb | 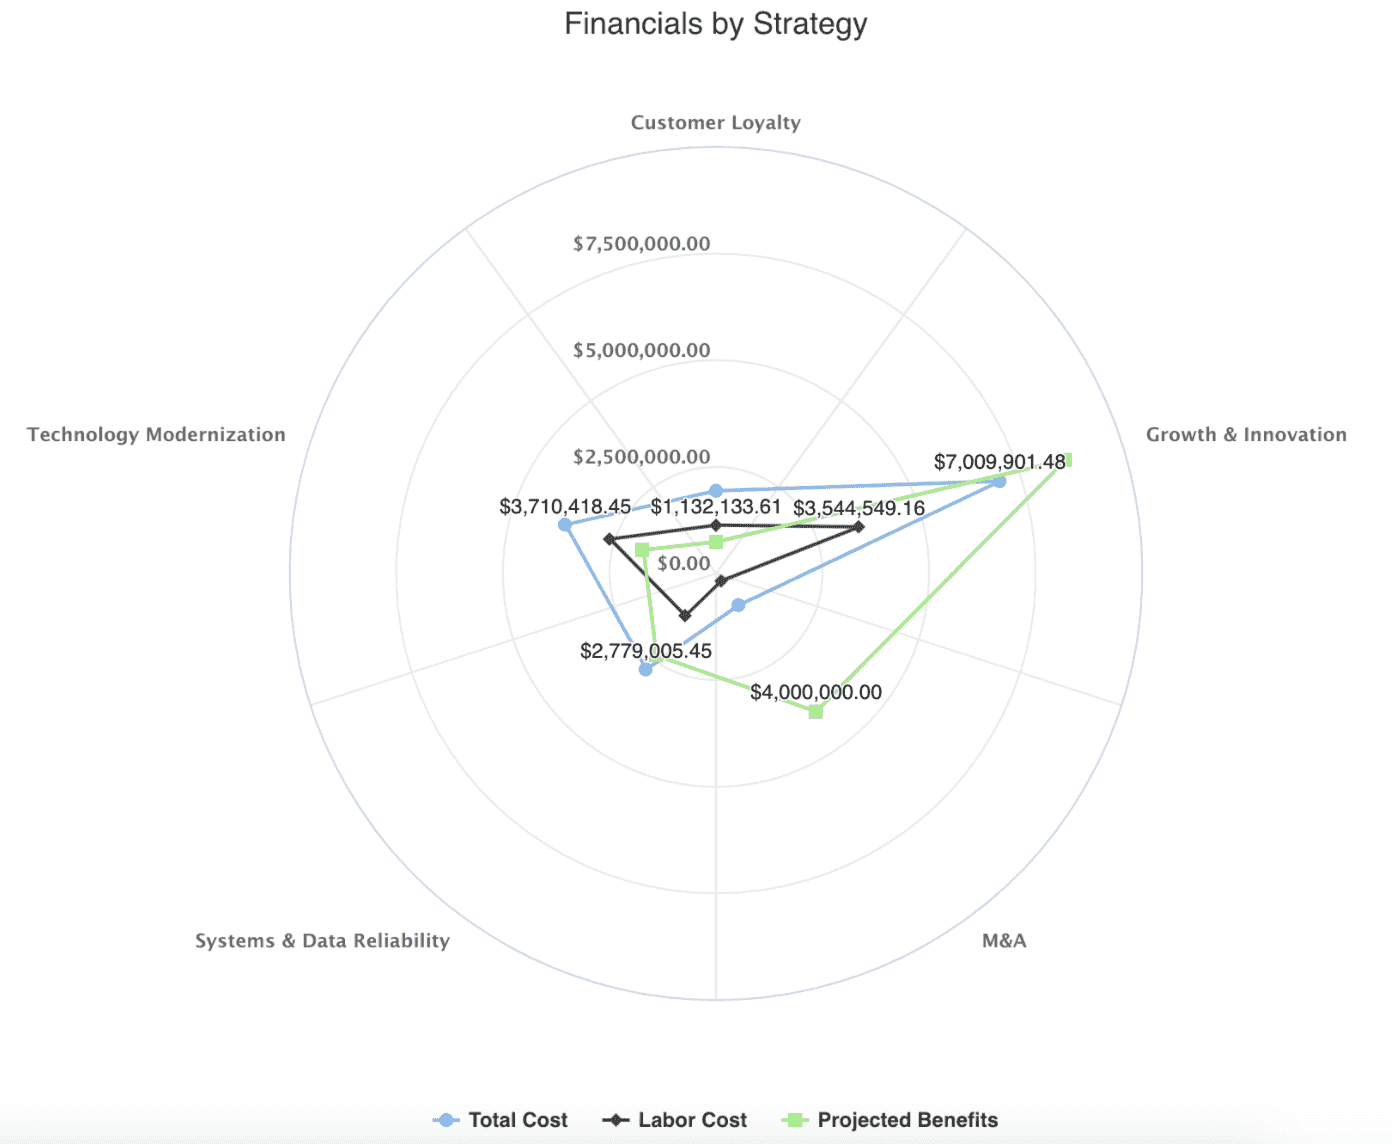 |
Project Financials by Business Objective - Get a visual picture of various financial costs and revenue given a specific project property, for all projects in a portfolio |
| 27 | Donut | 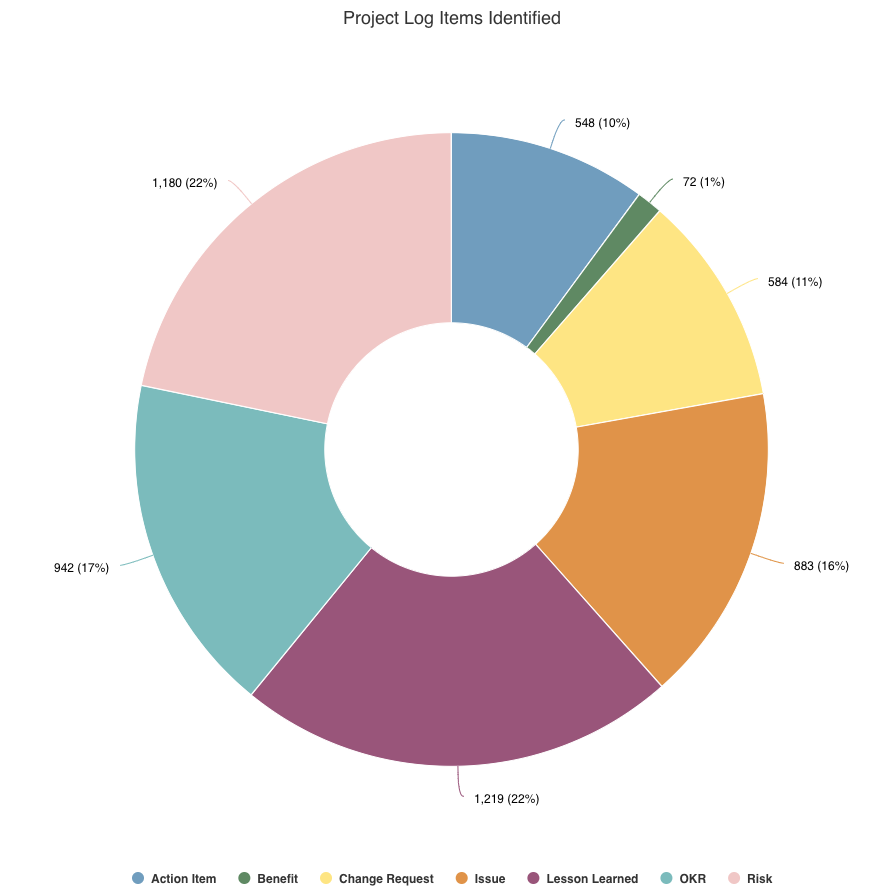 |
Project Logs - See how many different project logs or issues exist for a project or set of projects |
| 28 | List: Stacked |  |
Project Overview - A simple project overview containing key information in a stacked display format |
| 29 | List: Basic | 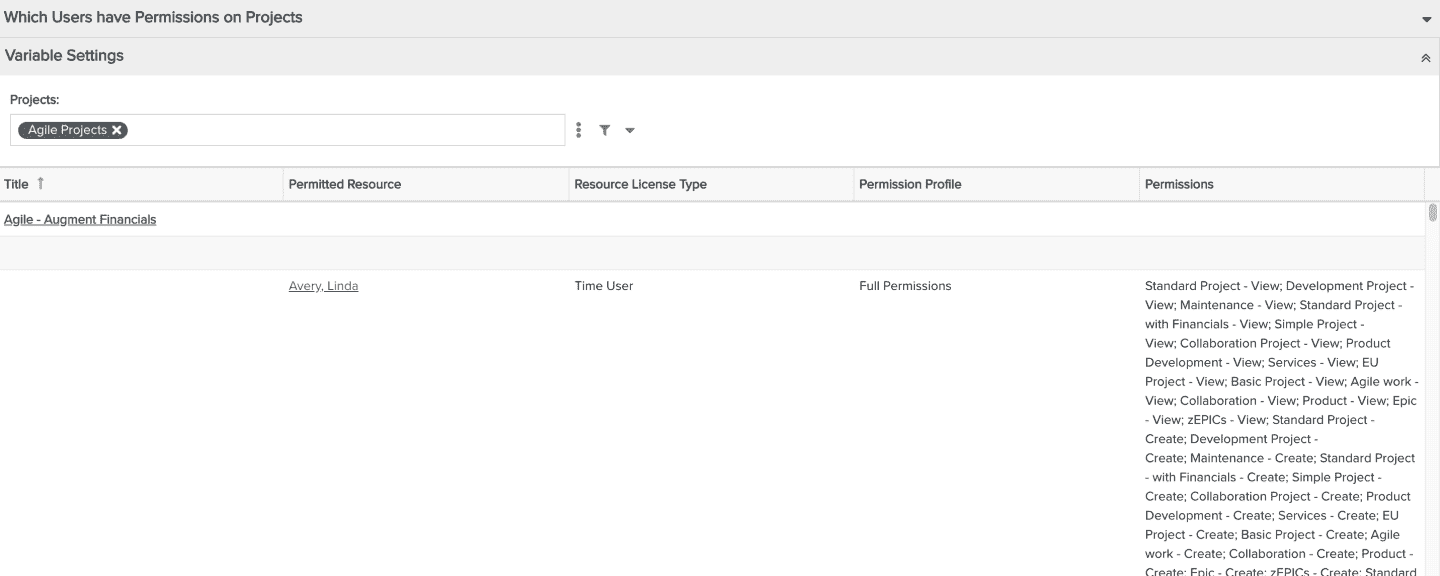 |
Project Permissions - Shows who has what permissions on projects (who has what permissions on an entity) |
| 30 | Spiderweb | 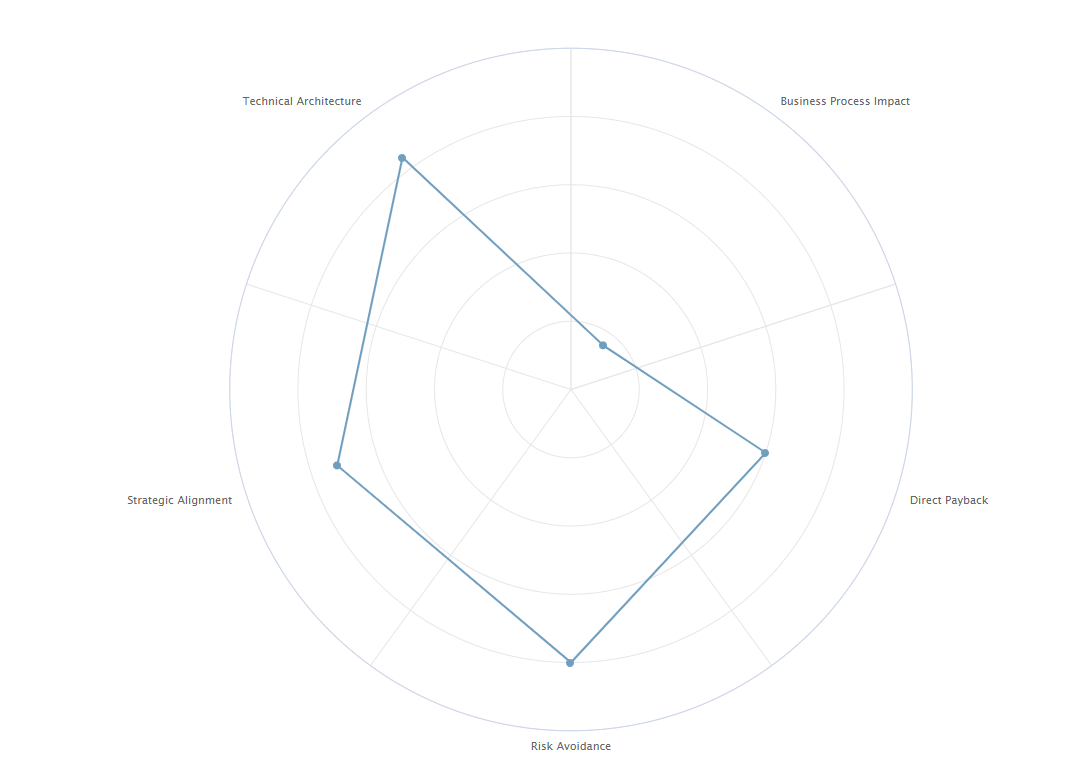 |
Project Scores by Scoring Category - Shows individual scoring category scores for a project or projects |
| 31 | List: Basic | 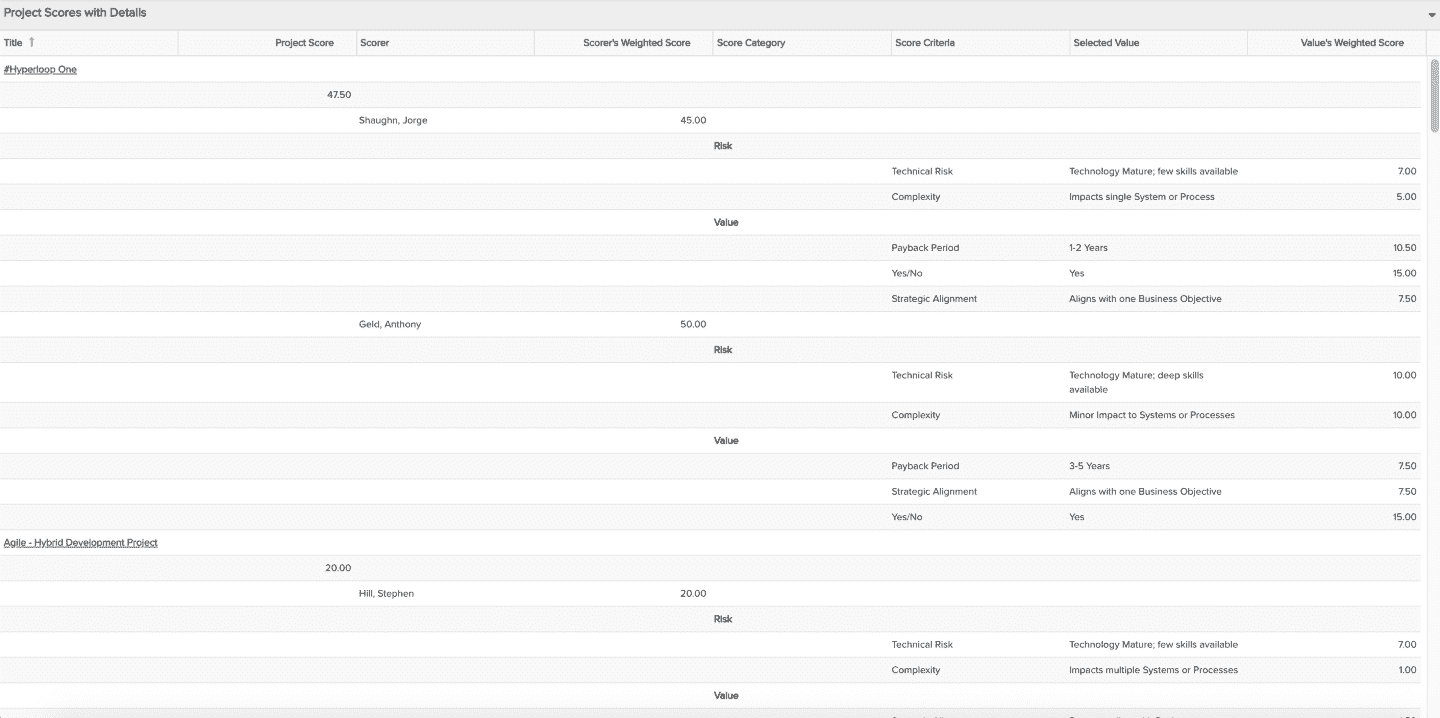 |
Project Scores with Details - Shows not only overall project score, but also scoring criteria selections by scorer |
| 32 | List: Time Series | 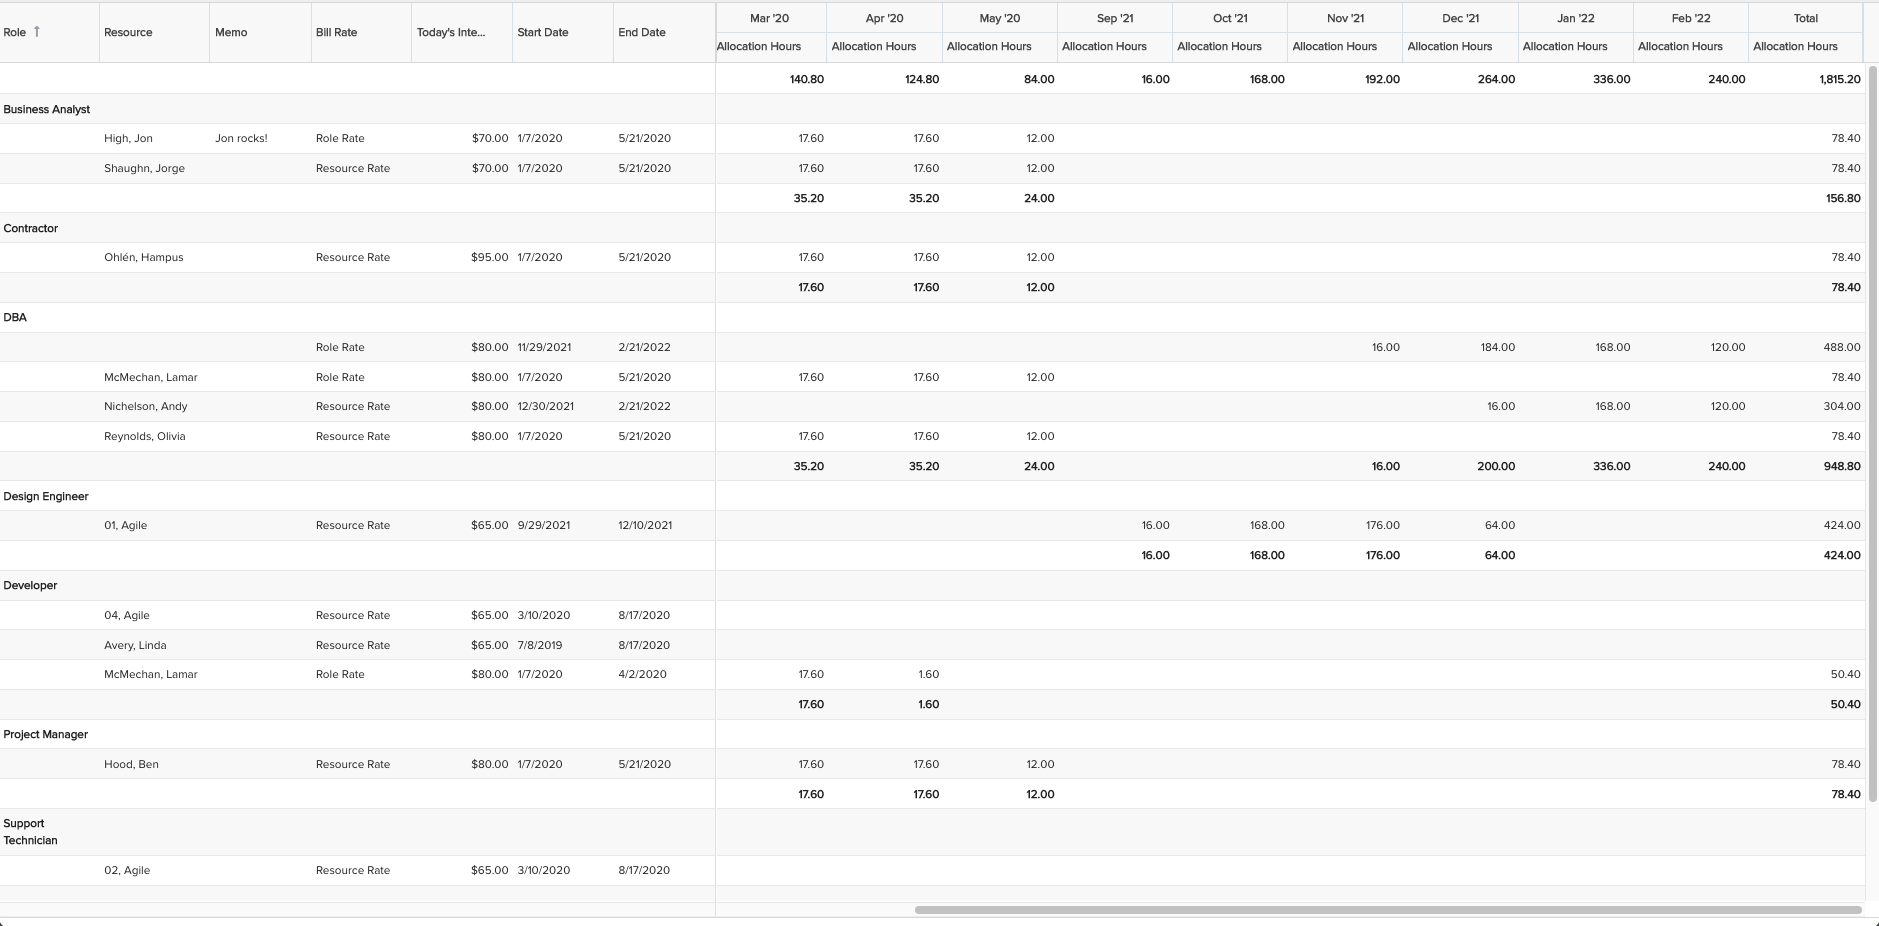 |
Project Staffing - Displays resource allocations on a project, mimicking the Project/Staffing view |
| 33 | Heatmap | 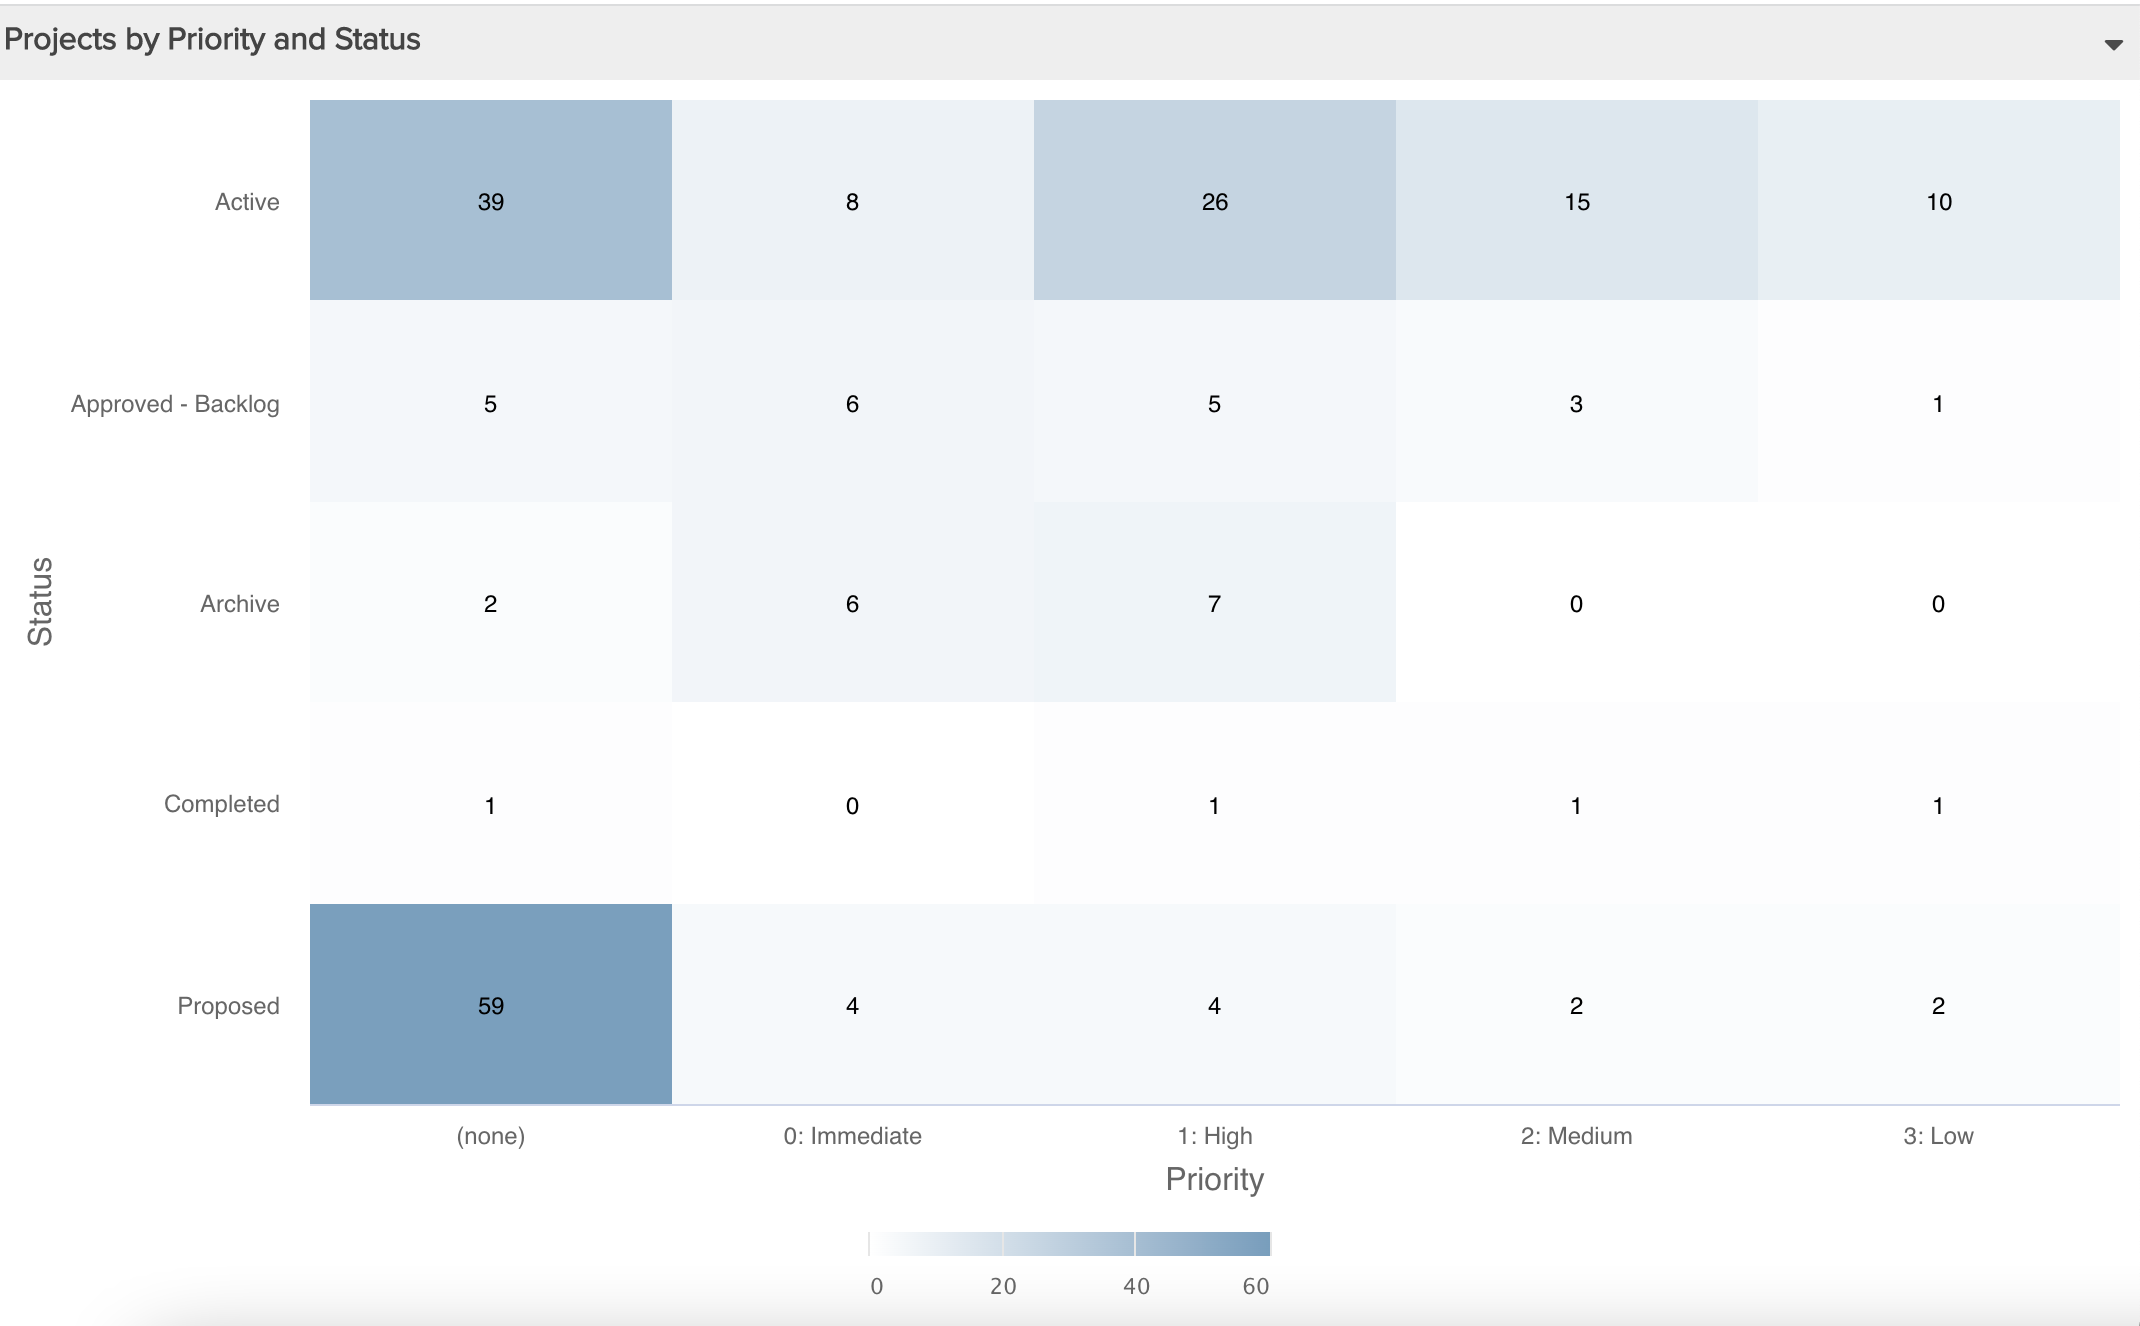 |
Projects by Priority and Status - View a heatmap distribution of projects given two attributes, such as Type and Business Objective |
| 34 | Column: Stacked | 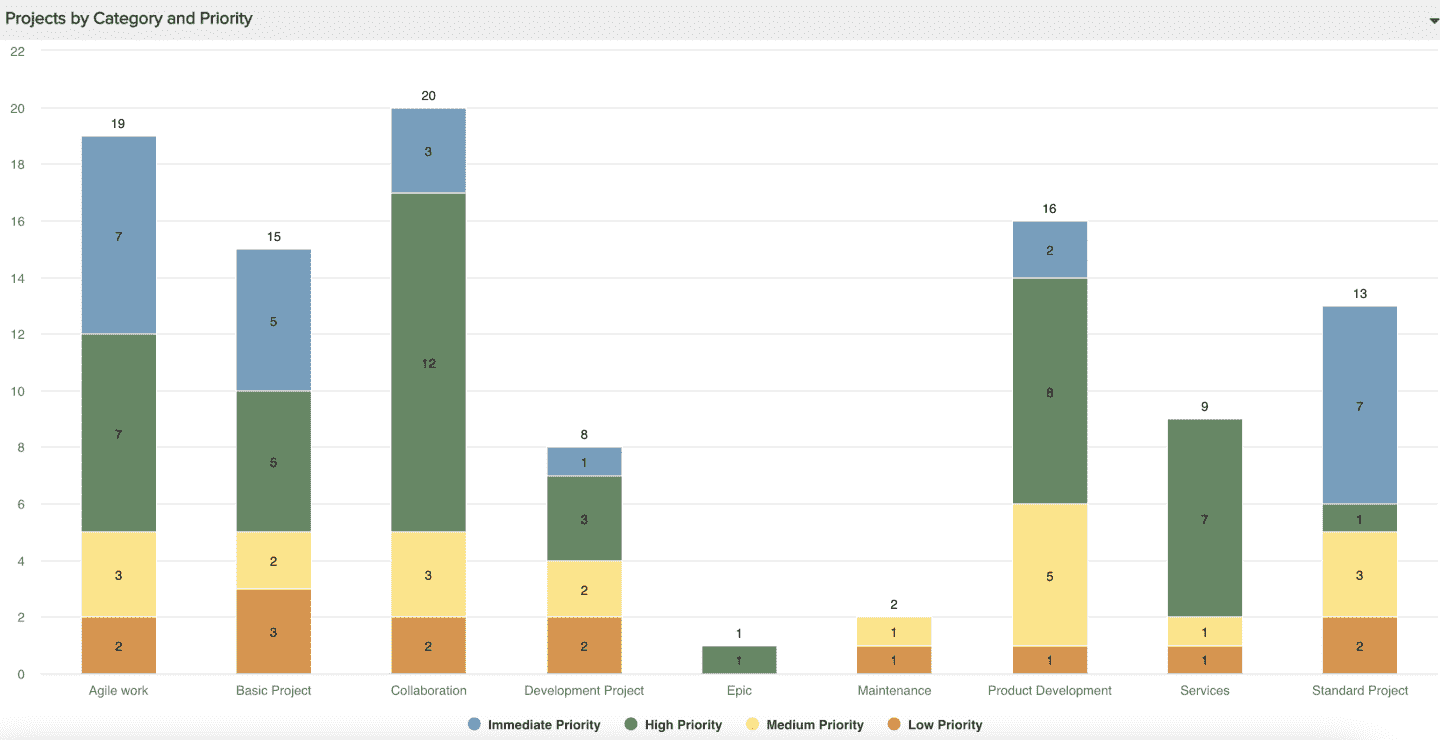 |
Projects by Category with Priority Stacks - Show the total number of projects by Category (or some other factor such as Business Objective, Department, and so on), where each column stack consists of counts per priority |
| 35 | Crosstab |  |
Resource Average Days per Request Action - Per resource, see the total number of days requests spend before the person took a specific action, the overall average days for all actions for a resource, and overall average days for all resources per action |
| 36 | Crosstab | 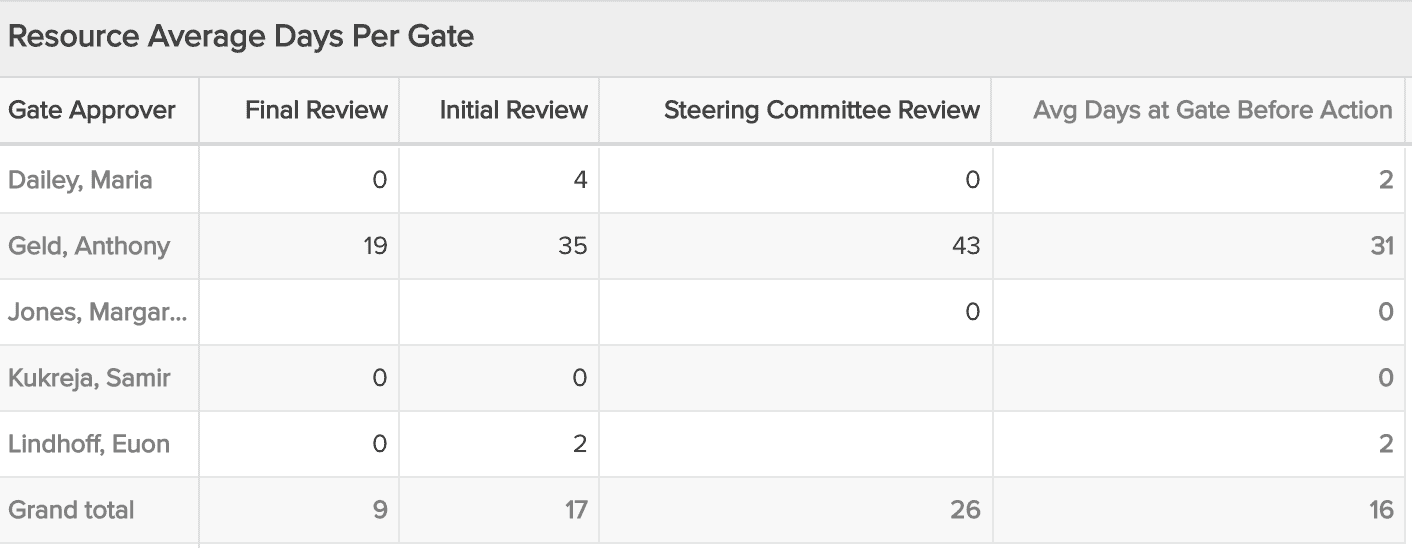 |
Resource Average Days at Request Gate - Per resource, see the total number of days requests spend at each workflow gate before the person took action, the overall average days at gates for a resource, and overall average days for all resources per gate |
| 37 | List: Basic | 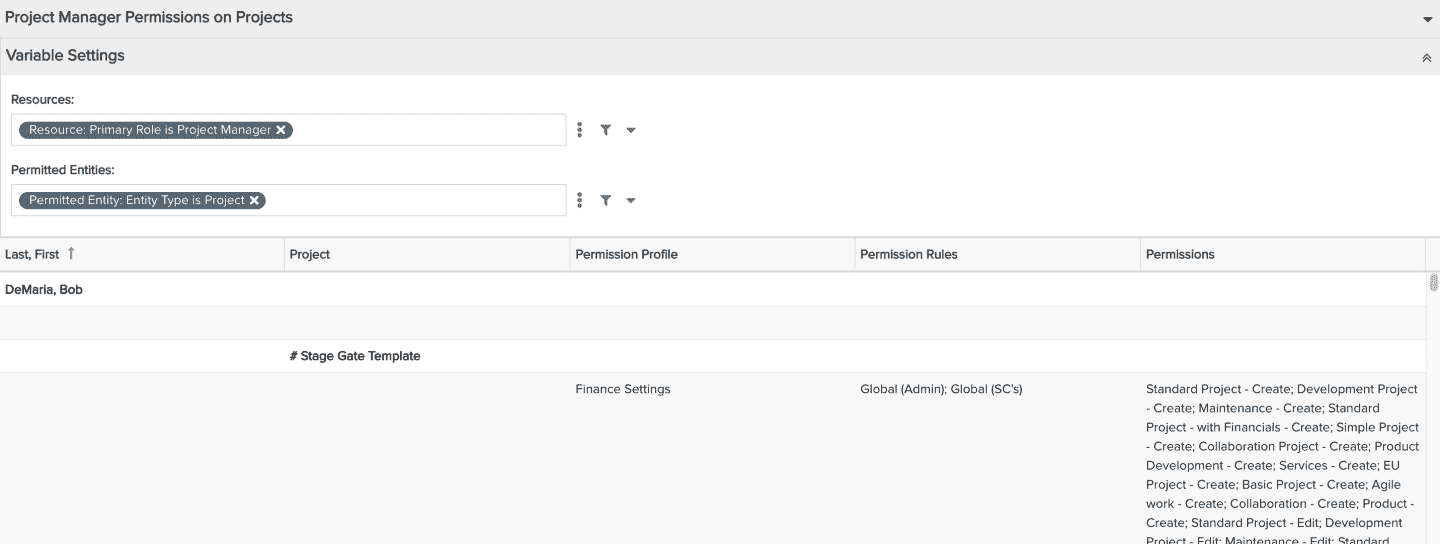 |
Resource Permissions - Shows what permissions a resource has on one or more entities |
| 38 | List: Basic | 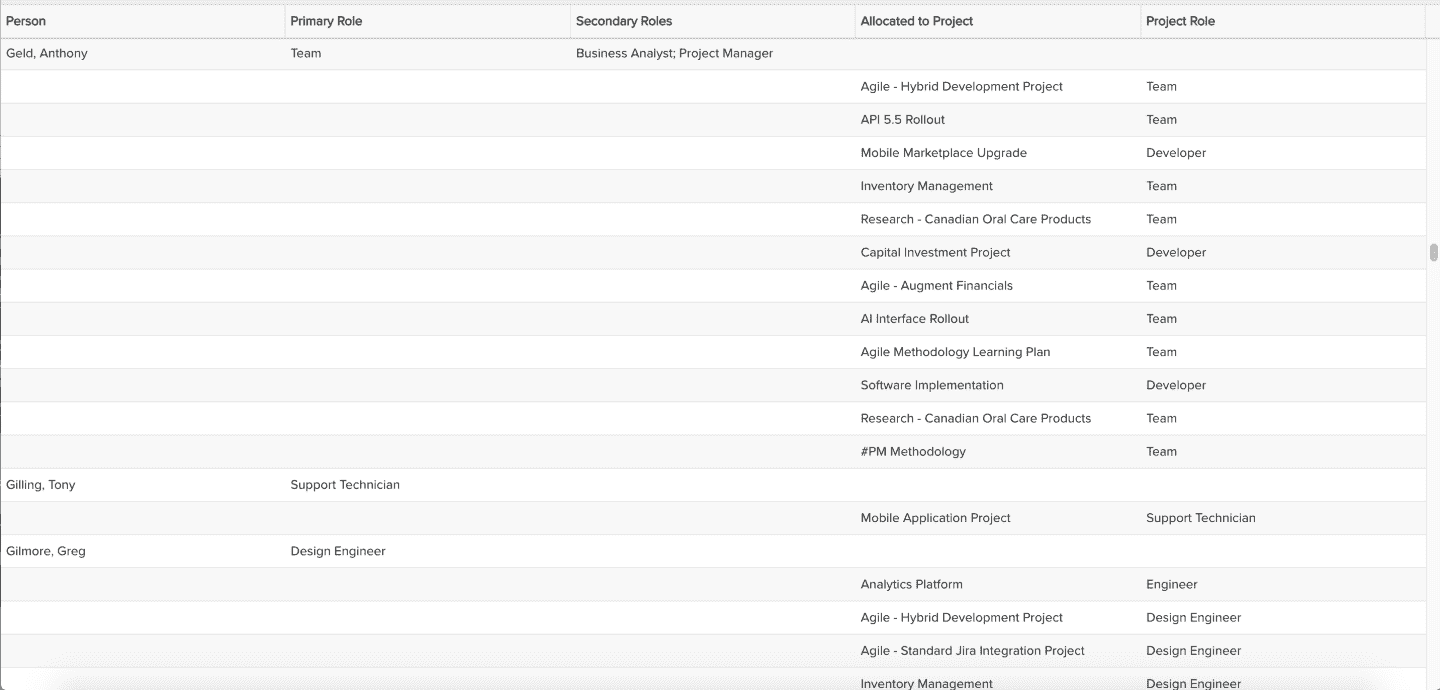 |
Resource Roles and Allocations - See all of your resource role and other details as well as project allocations |
| 39 | List: Time Series |  |
Resource Workbench Allocations aka Bottom Half of Home/Resources View - Displays resource allocations on projects, mimicking the bottom half of Home/Resources view (also known as the Resource Workbench). This report is a great drill-down report from the Resource Workbench Utilization report (which mimics the top half of the Home/Resources view). |
| 40 | List: Time Series | 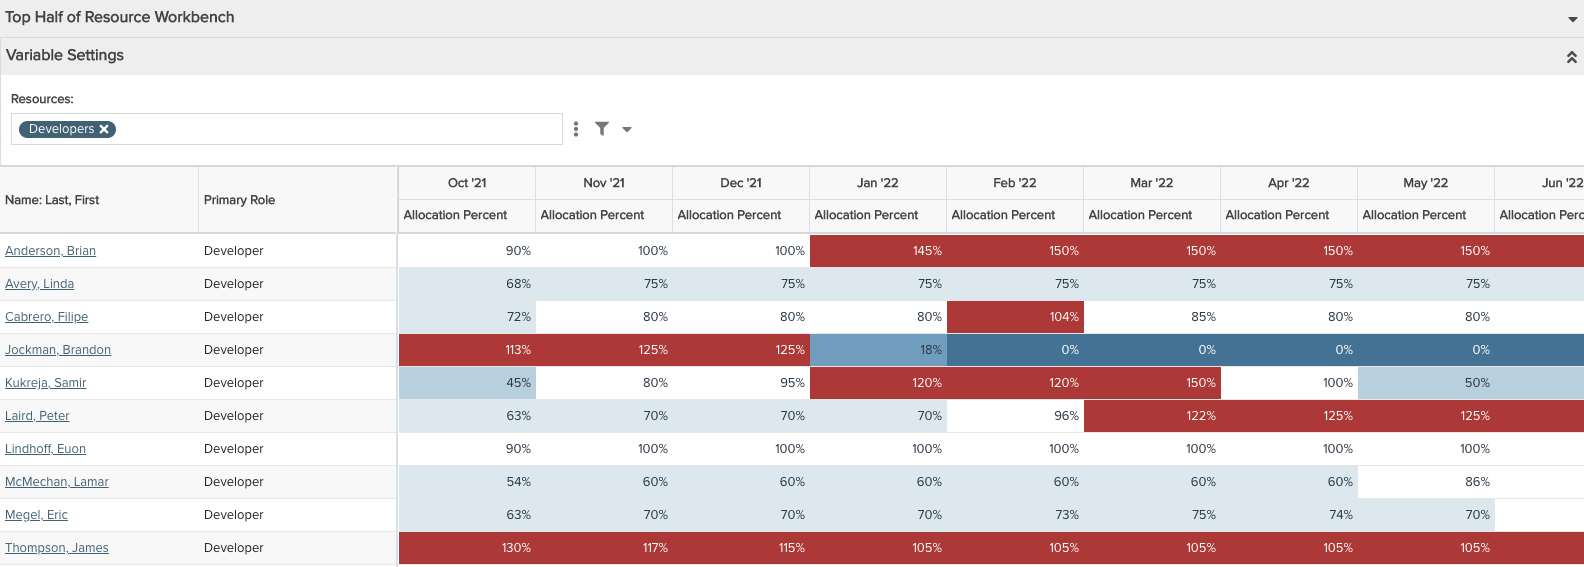 |
Resource Workbench Utilization aka Top Half of Home/Resources View - Displays resource utilization, *almost* mimicking the top half of Home/Resources view (also known as the Resource Workbench). *Almost* because the Resource Workbench automatically filters out Implied Closed projects, whereas this report will display allocation percents based on all projects. So if you have resources allocated to one or more closed projects for the time period displayed, the values will not exactly match what is in the Resource Workbench top half of the grid. |
| 41 | Combination: Area, Column, Line | 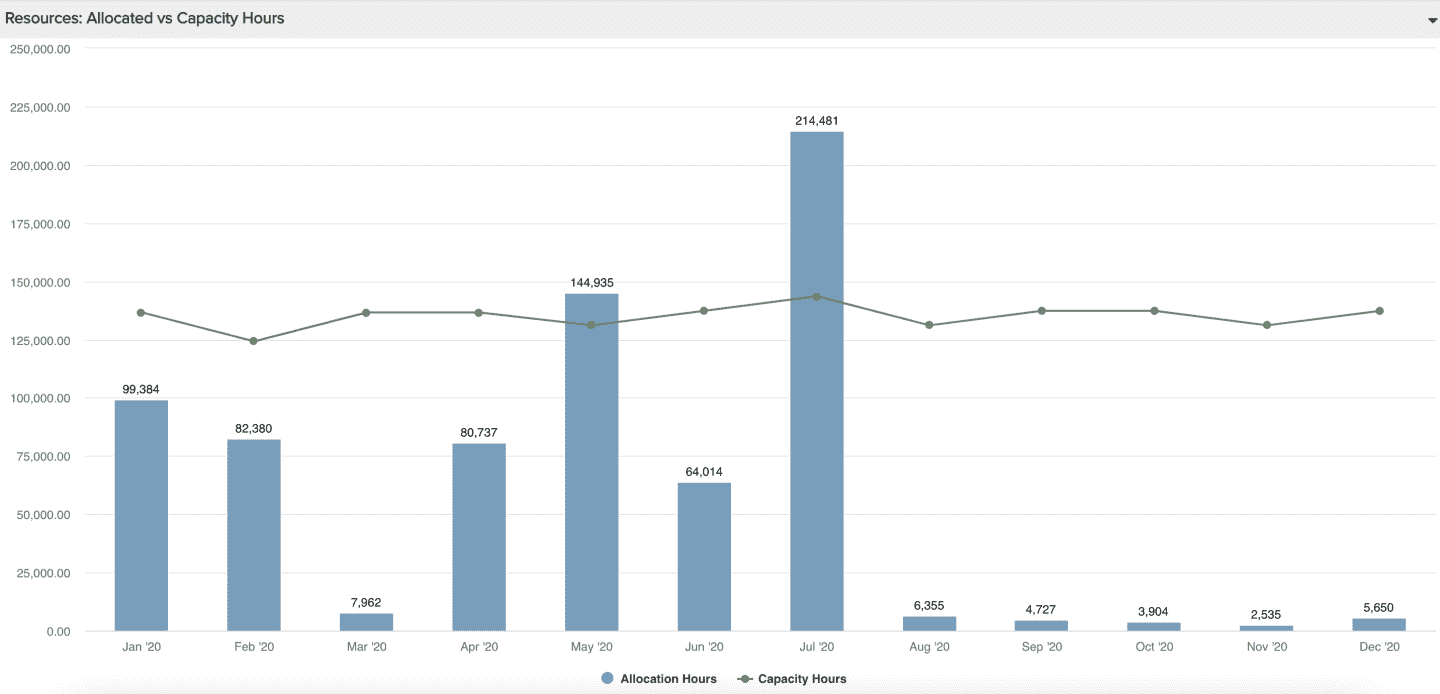 |
Resources - Allocated vs Capacity Hours Time Series - Compare allocated hours versus capacity hours for your resources for a given time period |
| 42 | List: Basic | 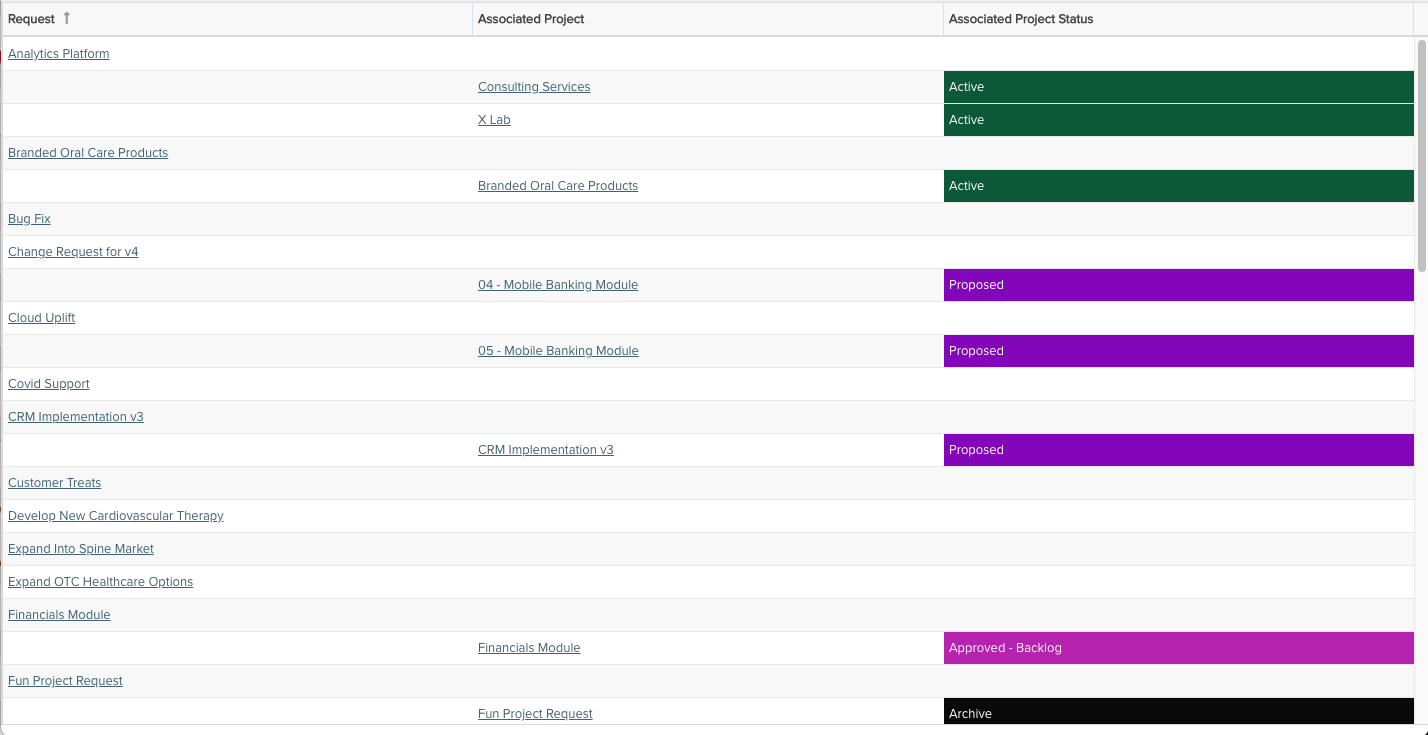 |
Request Associated Projects with Status - Show each request's associated projects and their project statuses |
| 43 | Crosstab | 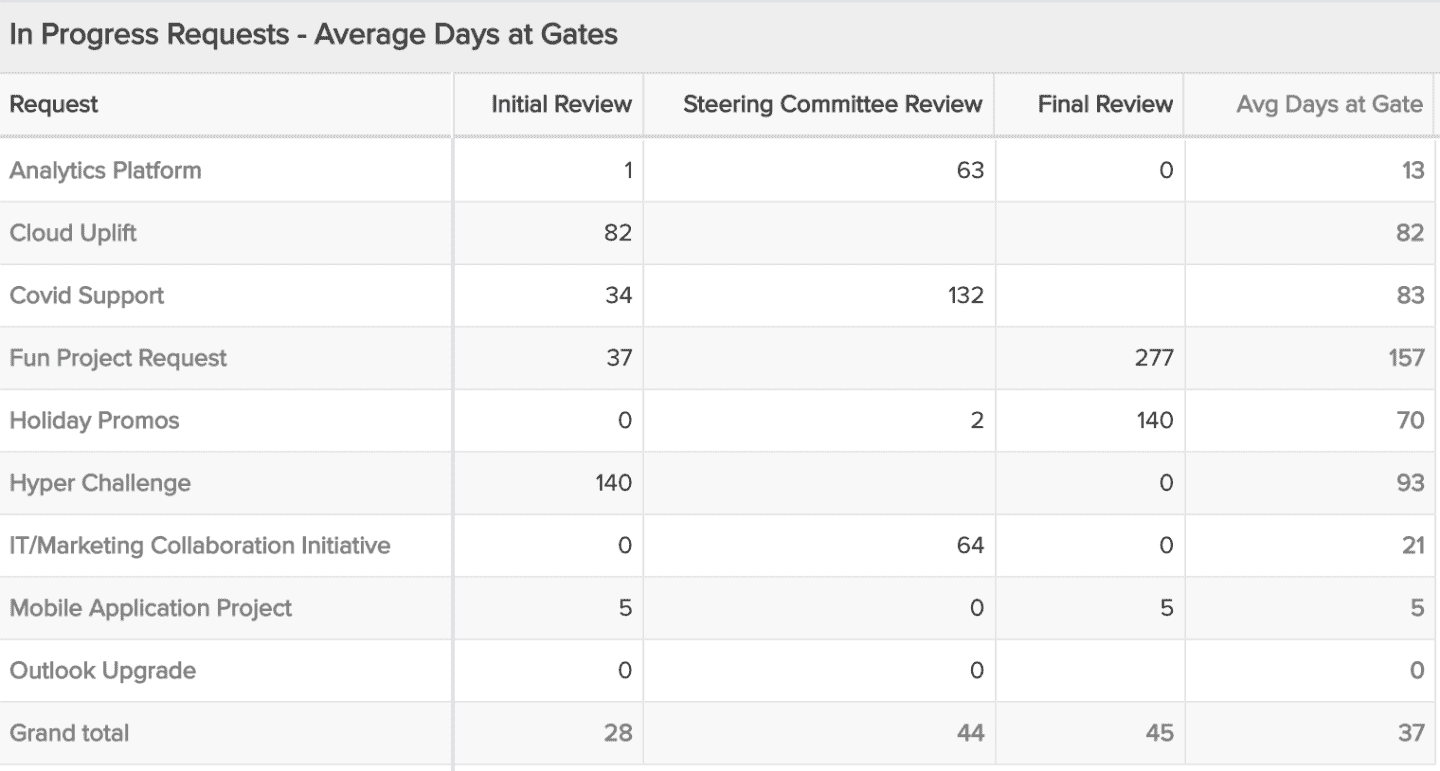 |
Request Average Days at Gates - Per request, see the total number of days it spent at each workflow gate and the overall average days at gates and overall average days for all requests per gate |
| 44 | List: Basic | 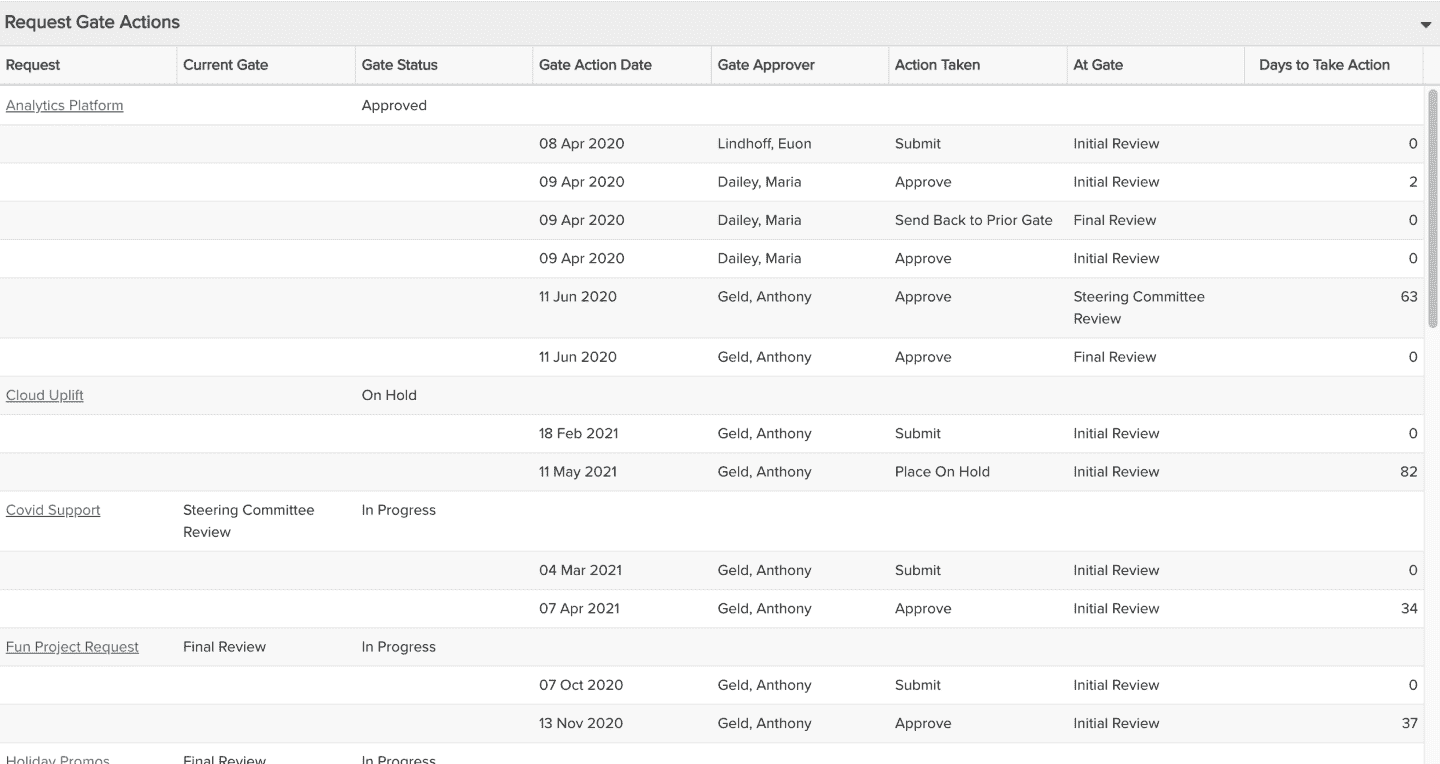 |
Request Gate Actions - Show the actions taken at each gate in its workflow including the date, actor, action, and days before action was taken |
| 45 | Combination: Area, Column, Line | 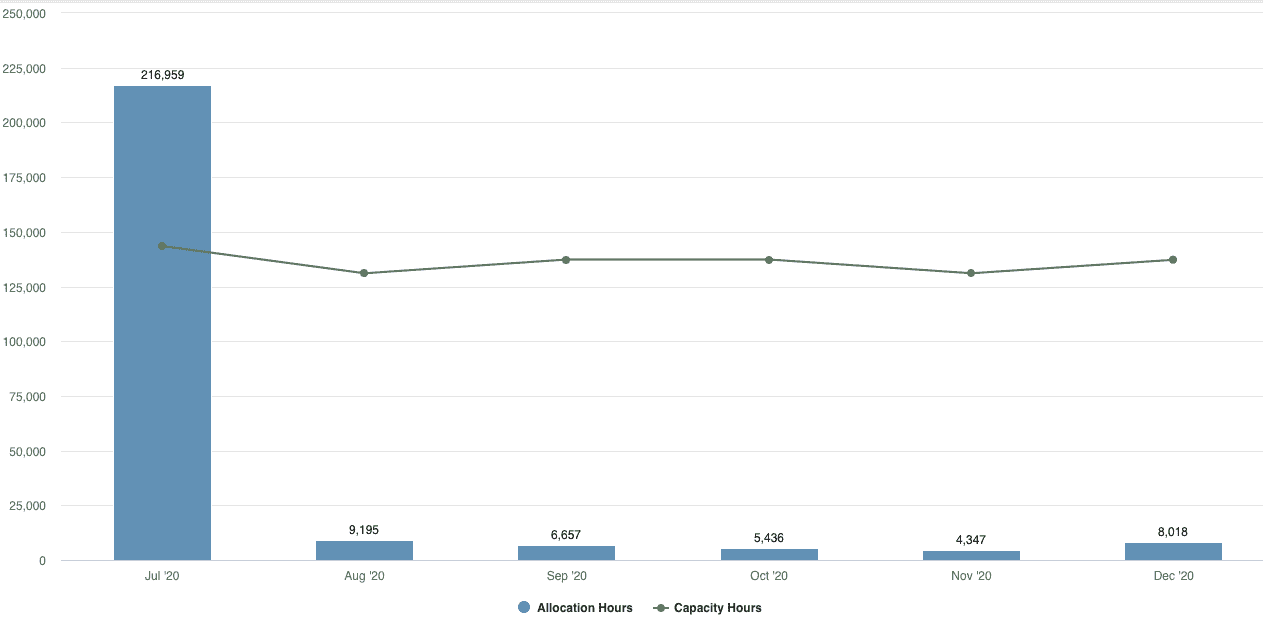 |
Role - Allocated vs Capacity Hours Time Series - Compare allocated hours versus capacity hours for your roles for a given time period |
| 46 | Area: Basic | 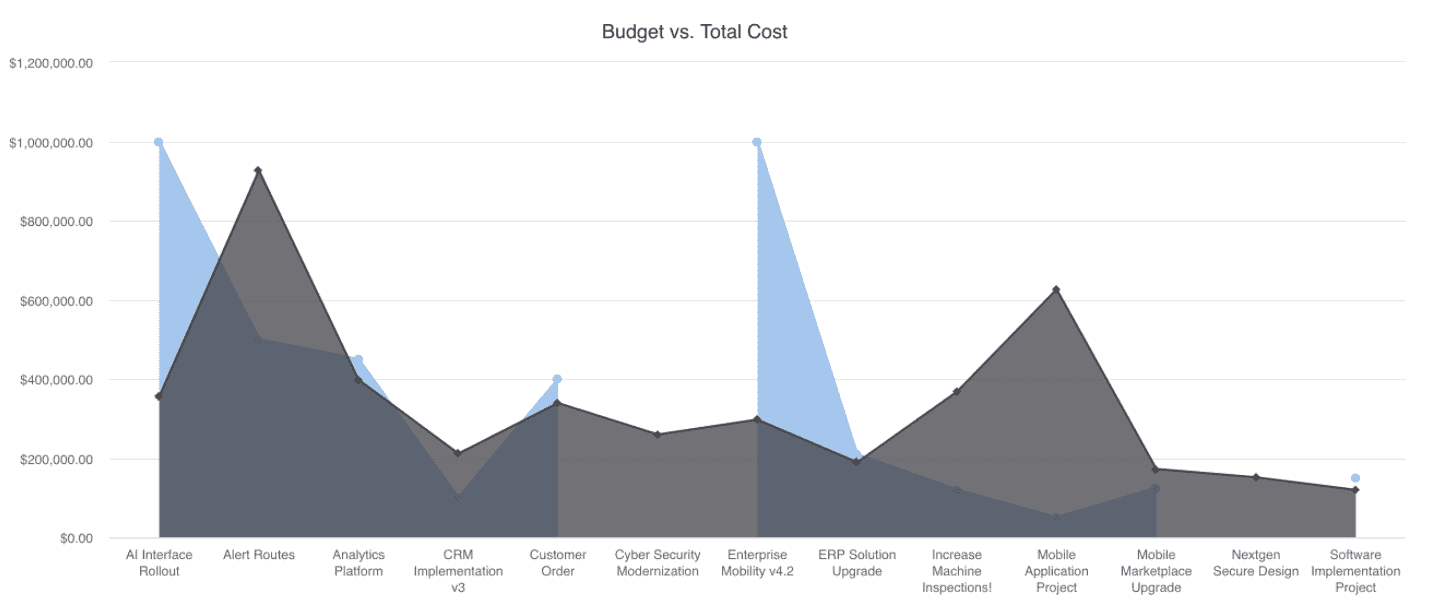 |
Simple Project Financials Comparison - Compare simple financial measures across a set of projects |
| 47 | Line | 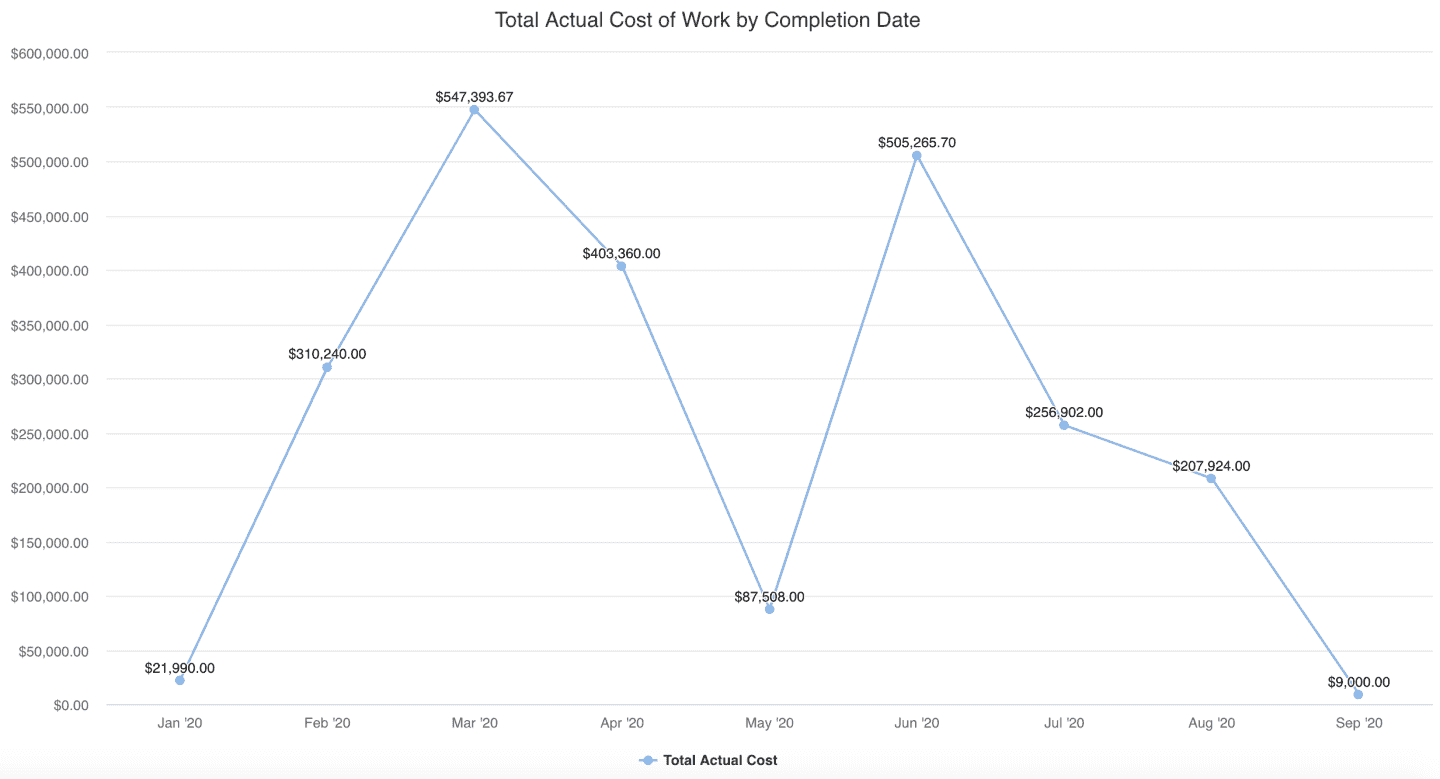 |
Simple Project Time Series - View financial or other field values over a date range for a set of projects, such as Total Actual Cost of Work by Completion Date |
| 48 | List: Basic | 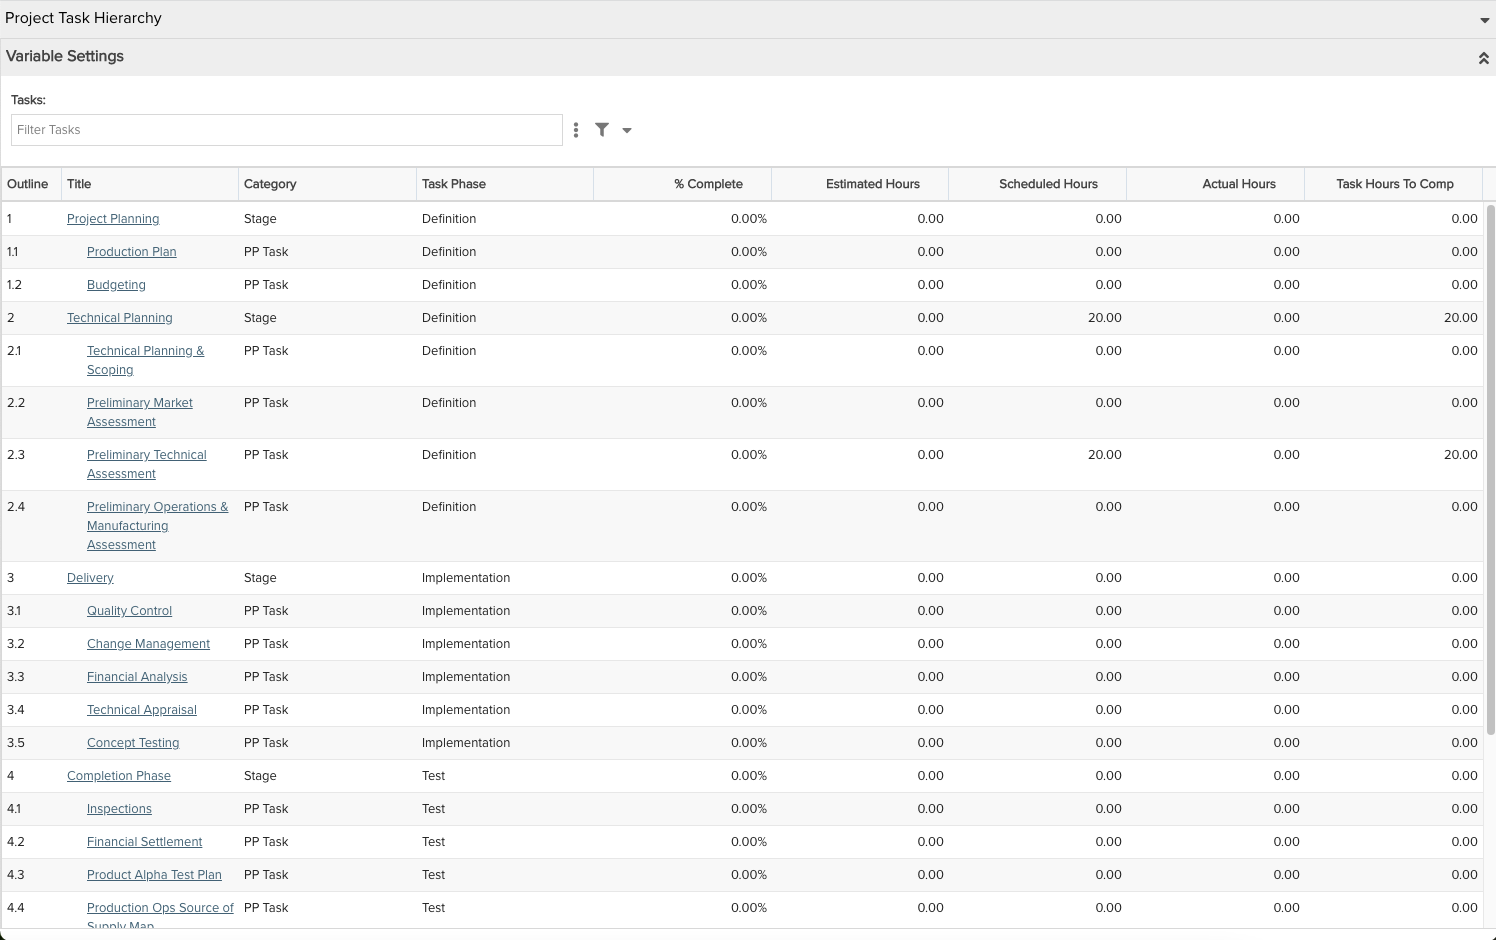 |
Task Hierarchy - Shows a project's task hierarchy with key details |
| 49 | Tile |
|
Tiles - Shows one or more numeric aggregated values for a portfolio, project, task, or other entity |
| 50 | List: Basic | 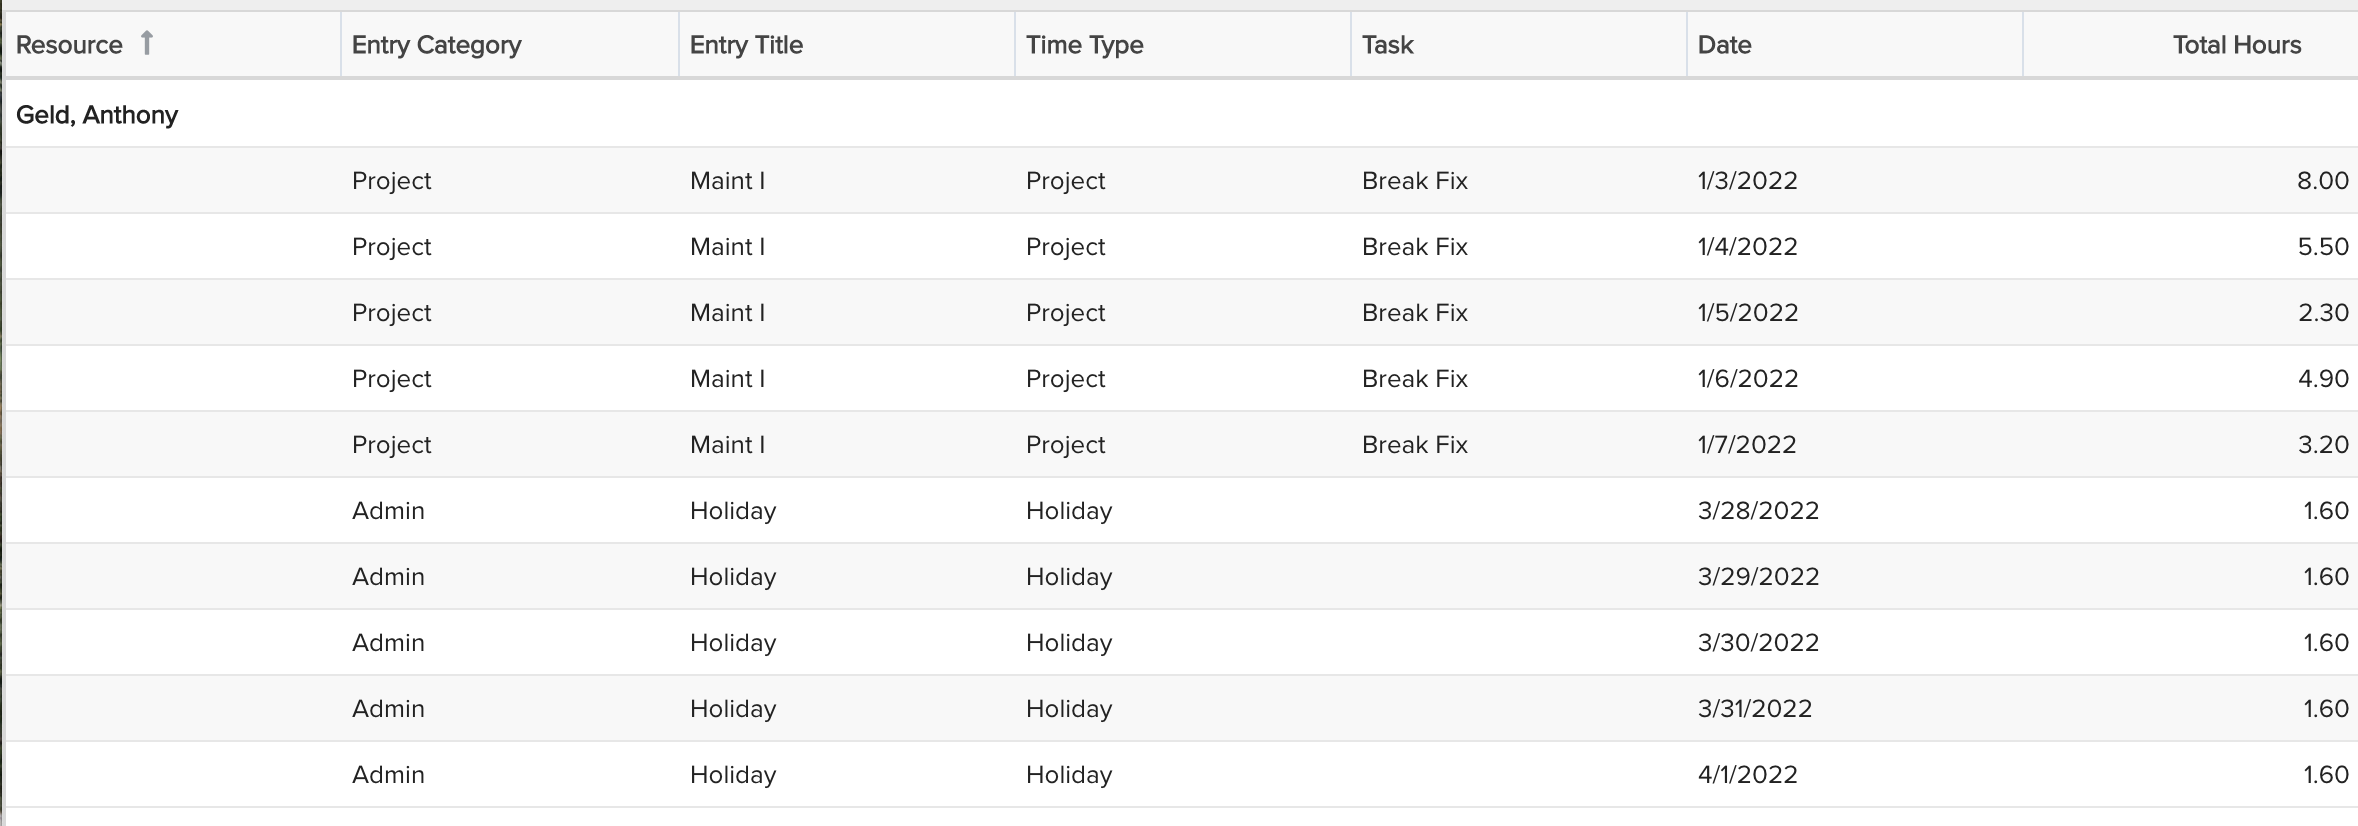 |
Timesheet Entries for a Resource by Category and Entry Type - Provides a list of resource timesheet entries with entry category (Admin, Project, Portfolio) and entry type (Project or Admin type), grouped by resource |
| 51 | Crosstab | 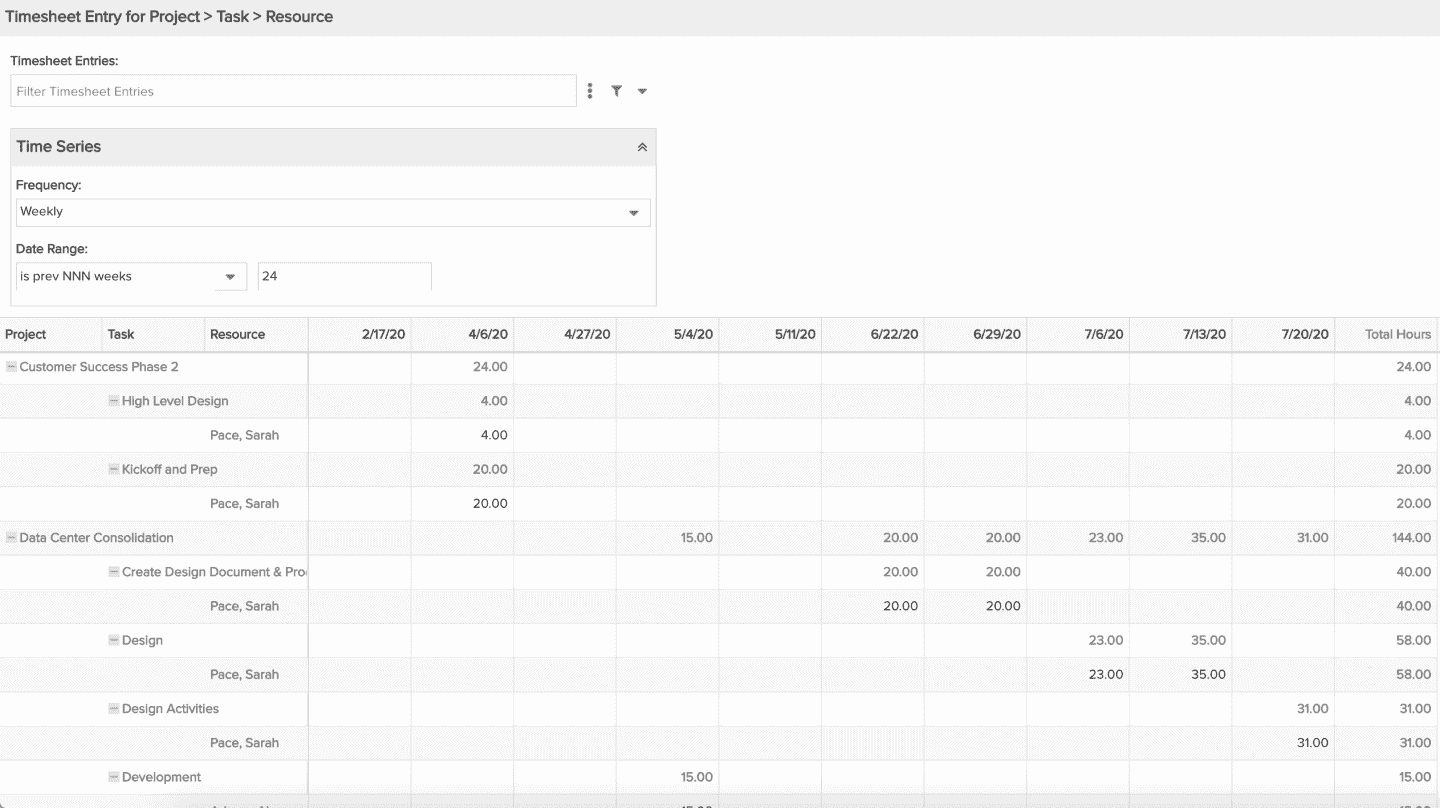 |
Timesheet Entries by Project-Task-Resource - Shows timesheet entries for projects, tasks, or resources |
| 52 | List: Basic | 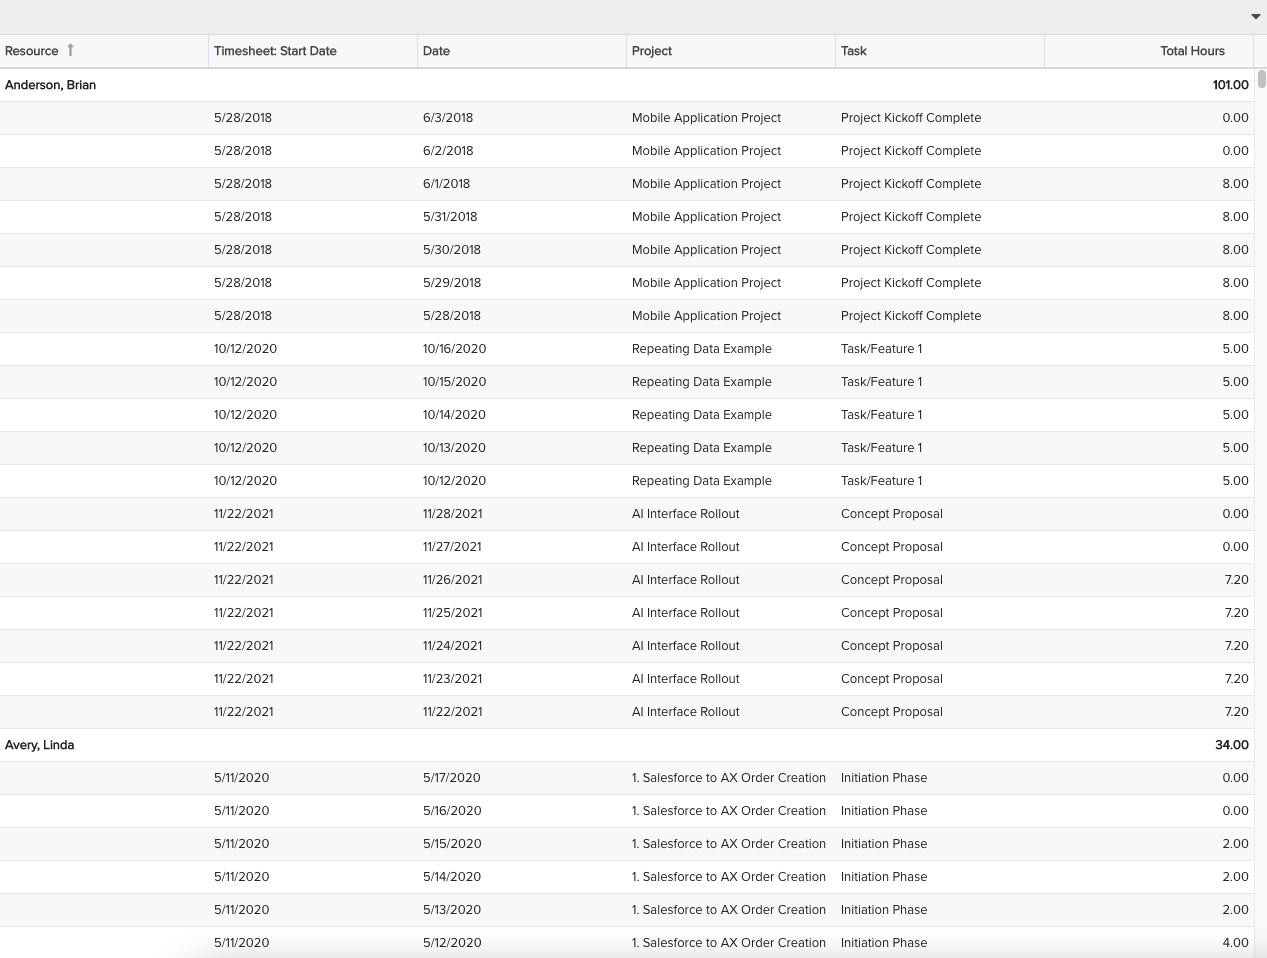 |
Timesheet Entries for this Week - Shows all timesheet entries in the current week for a set of resources |
| 53 | List: Basic | 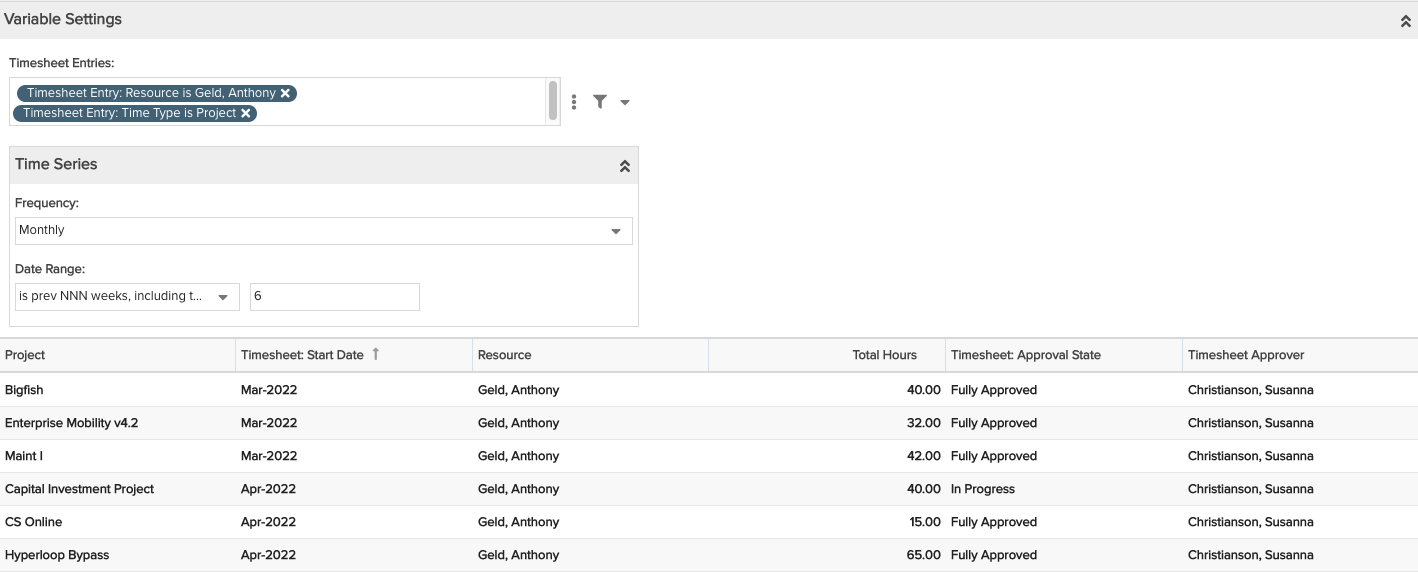 |
Timesheet Entries Totaled by Project and Resource - Shows timesheet entries aggregated by project and resource |
| 54 | List: Basic | 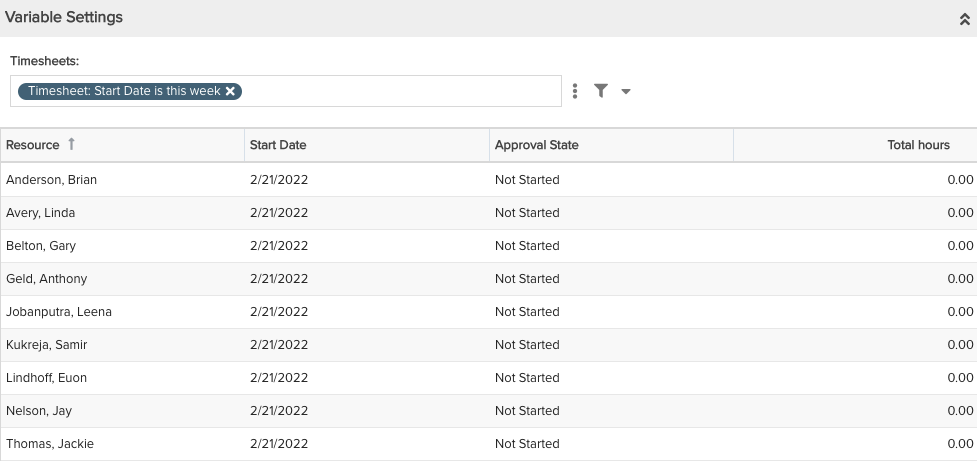 |
Timesheets for this Week - Shows resource timesheet details for timesheet start dates in the current week or any specific time period, resource, or other property |
| 55 | Column: Stacked | 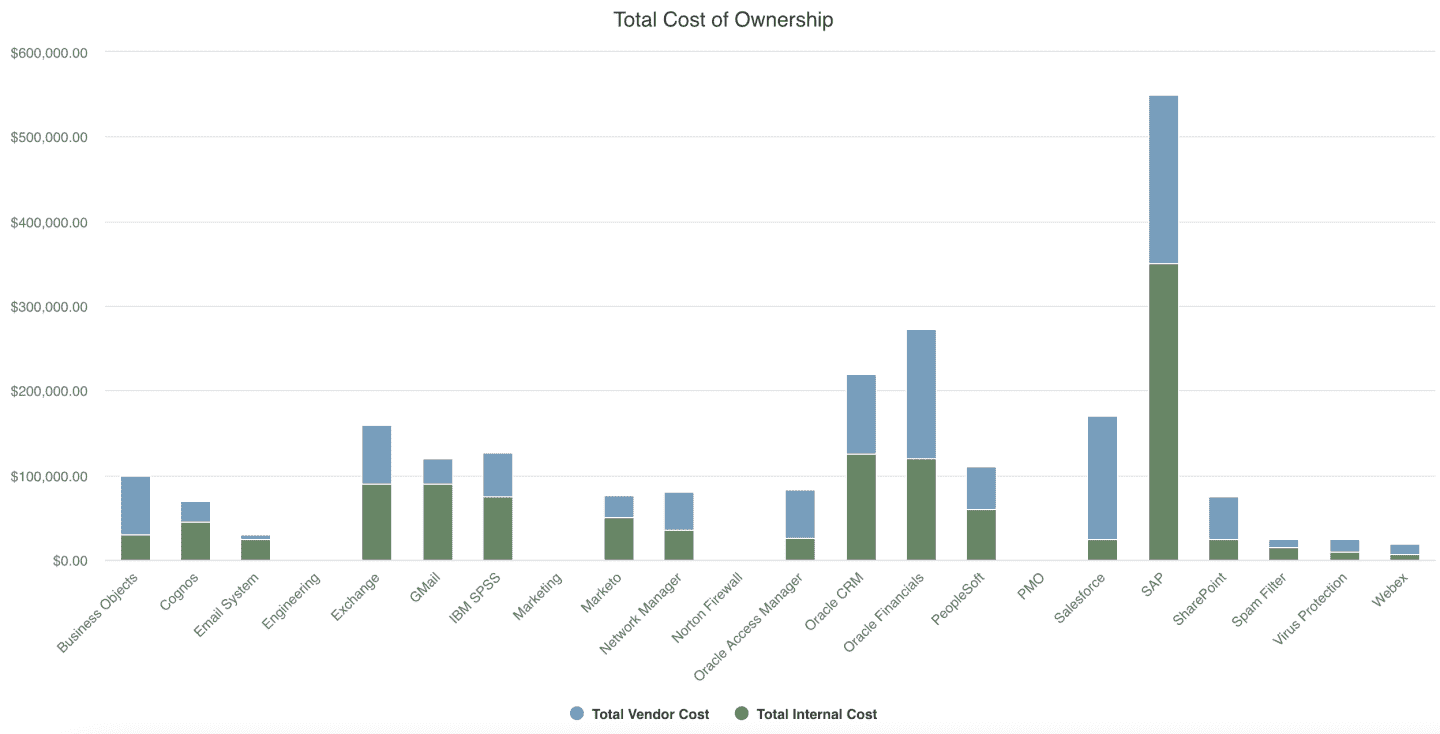 |
Total Cost of Ownership - View total costs broken out by their discrete categories |
| 56 | Crosstab | 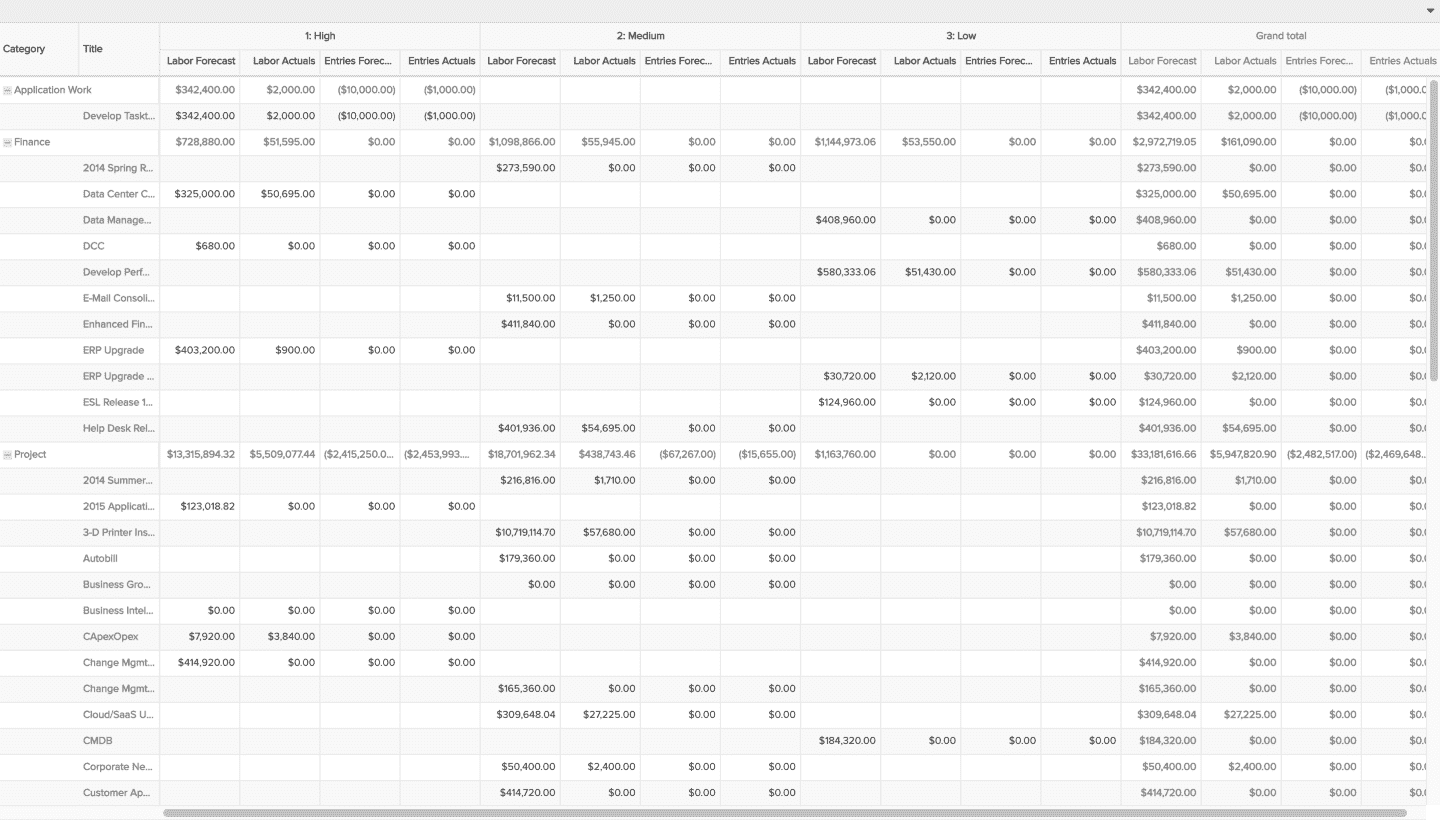 |
Total Forecasts and Actuals - Shows a crosstab of project total costs from Financial Entries Forecasts and Actuals along with Staffing Forecasts and Timesheet Actuals, broken out by project priority and summarized by project category |
| 57 | List: Basic | 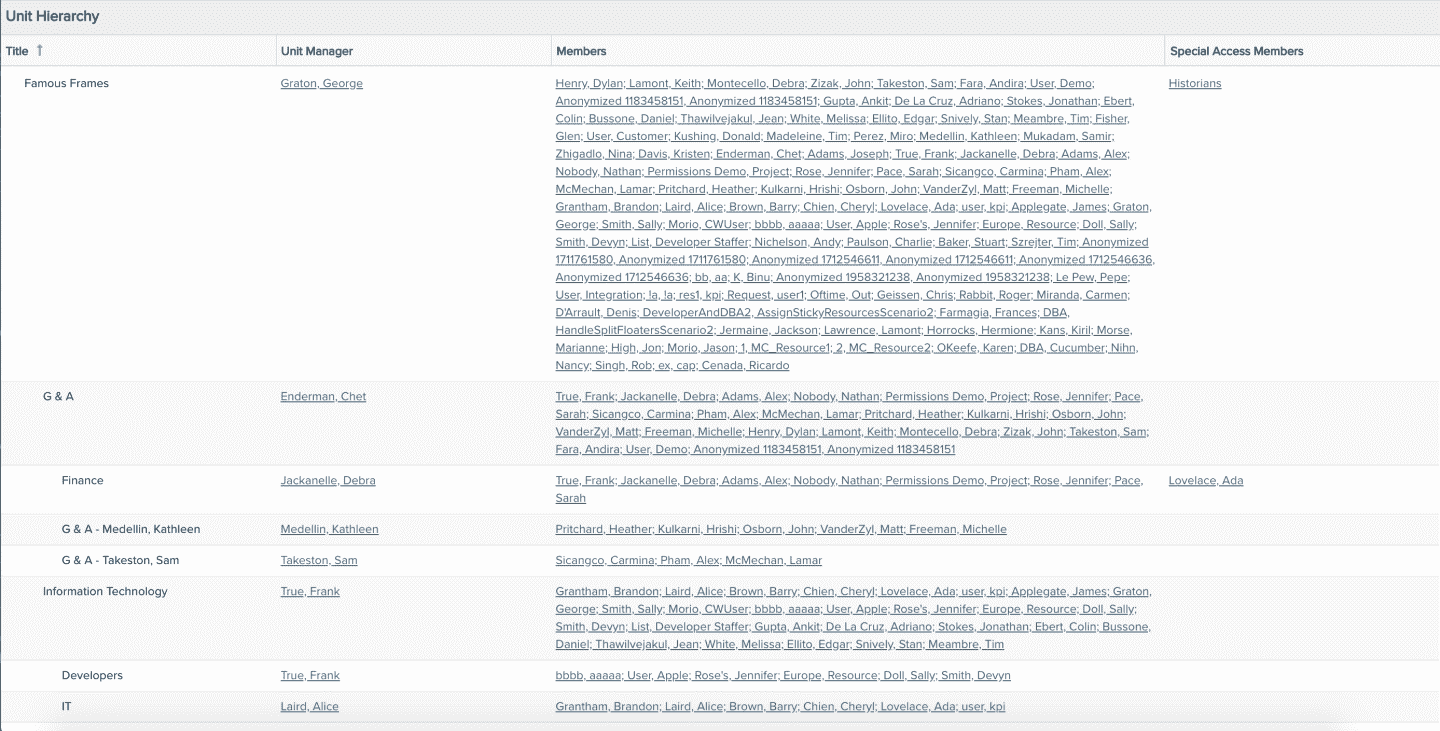 |
Unit Hierarchy - Shows the organizational unit hierarchy with unit manager and membership details |
| 58 | List: Basic | 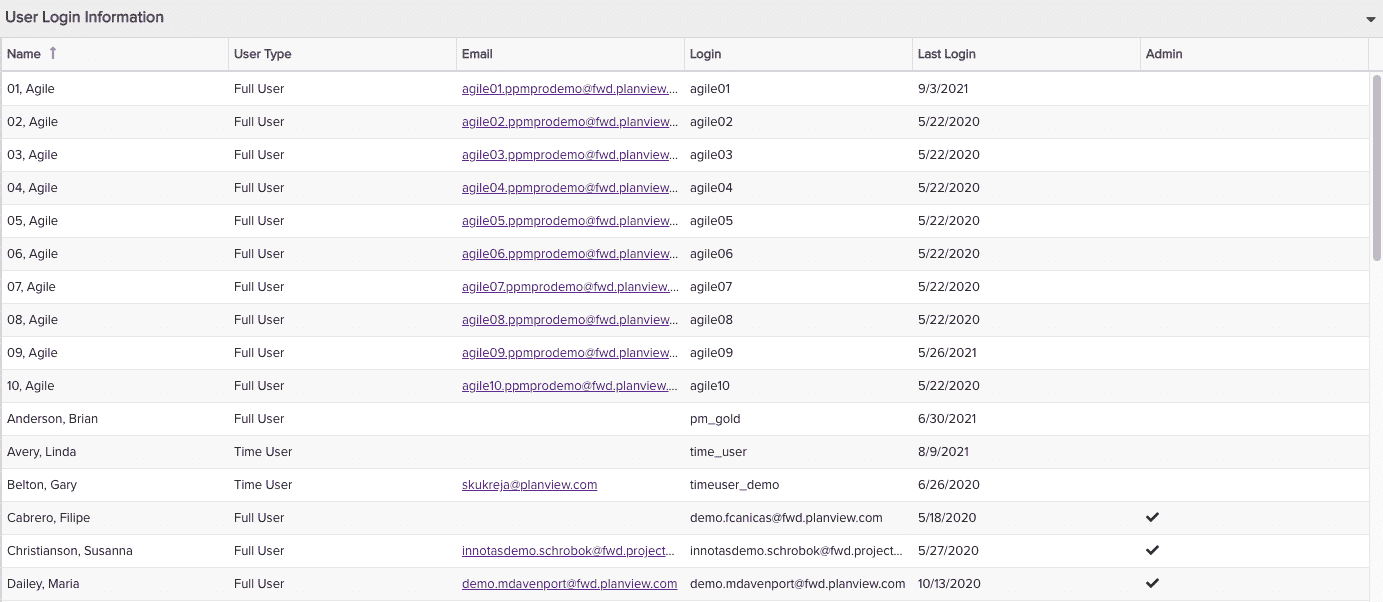 |
User Login Information - Shows various user information, including the last time users actually logged in |

