Flow
The Flow Report shows the relative amount of work in progress for each lane (or section of the board) over time. With it you can see how smoothly the work is flowing through your process. Variations in the width of the colored bands in the chart indicate more or less work in that lane on a given date. Widening bands represent an increase in the number of cards (or size) in a particular lane, which could indicate a bottleneck or constraint in your workflow process. The amount of work in process is also a good predictor of the remaining cycle time.
Here you'll learn how to:
- Access the Flow report
- Understand the Flow report
- Configure the Flow report
- Filter the Flow report
- Export the Flow report
Access the Flow Report
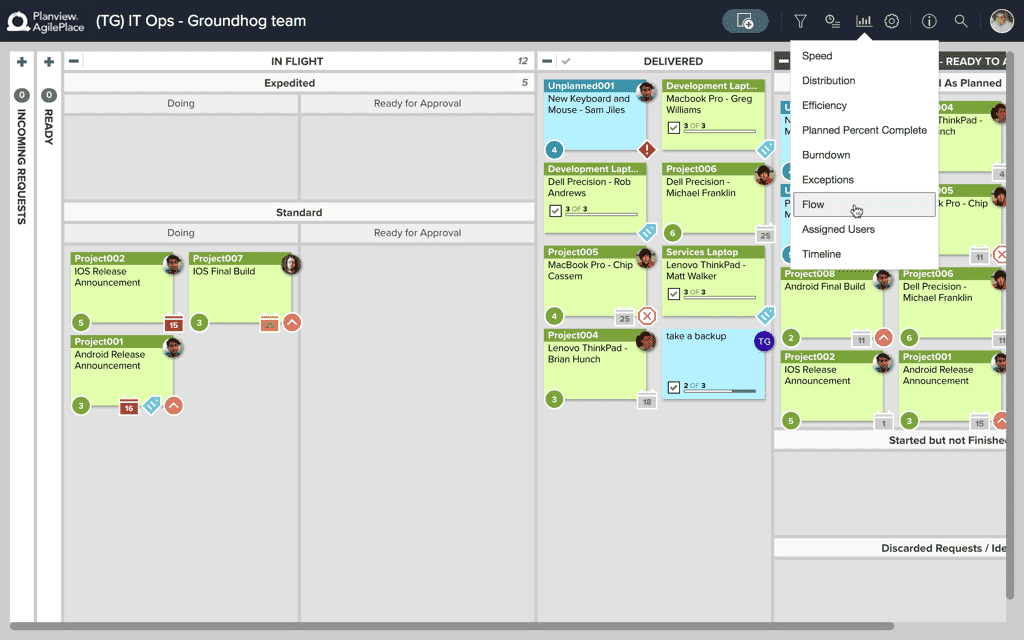
To access a board's Flow report, click the charts icon in the upper right of a board, and choose Flow from the menu.
Understand the Flow Report
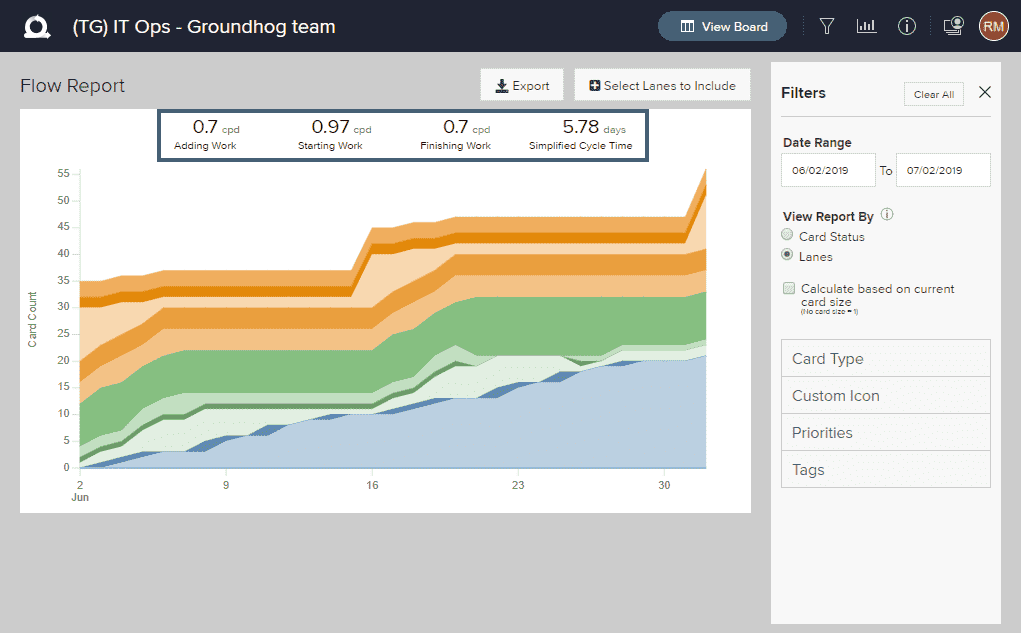
The Flow report has two viewing options:
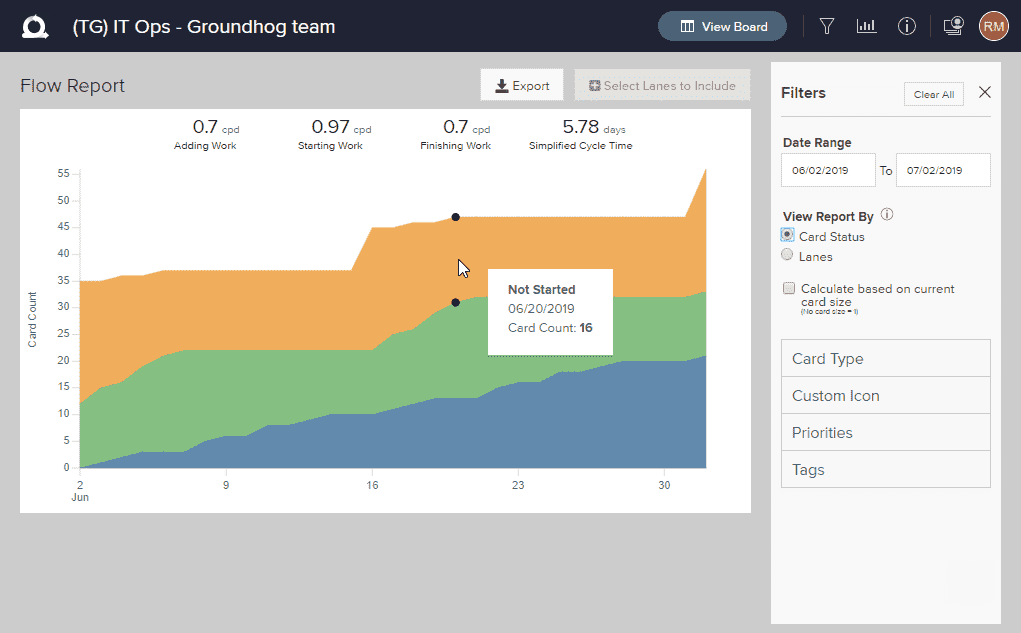
- The Card Status view categorizes lanes into Not Started, Started, and Finished sections.
- The Lanes view allows you to select specific lanes to include in the report.
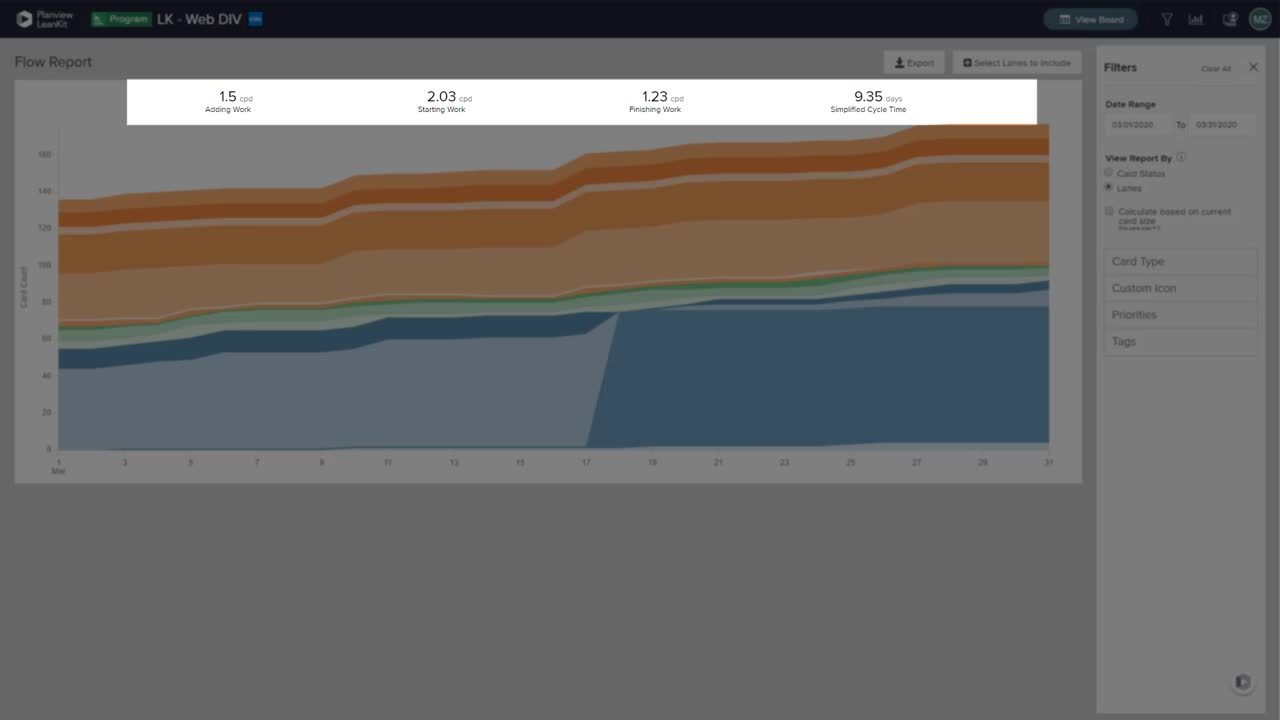
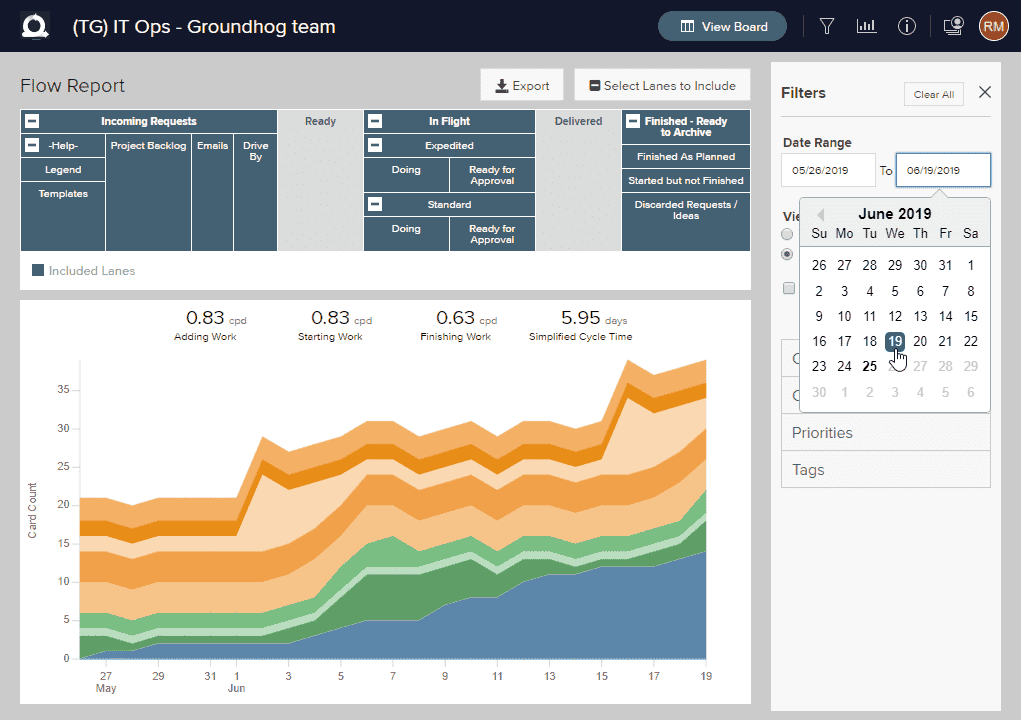
The default options present the Flow report with all lanes included and covering the last 30 days of history. Hovering over the diagram will display each of the included sections/lanes, as well as the queue size for that section/lane for the aligned date.
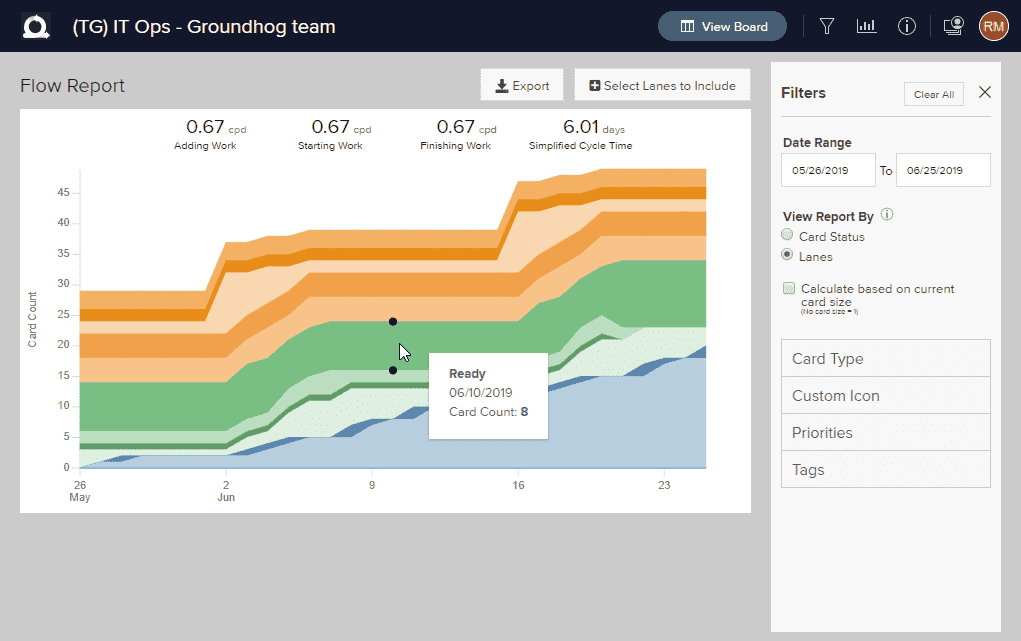
- Adding Work: The rate (per day) at which you are adding cards (or sizes) to the selected Not Started lanes.
- Starting Work: The rate (per day) at which you are creating cards in started lanes, or moving cards into Started lanes.
- Finishing Work: The rate (per day) at which you are moving cards into Finished lanes.
- Simplified Cycle Time: The average amount of time it takes cards to move from the selected Not Started to Finished lanes.
Configure the Flow Report
The Flow report provides multiple options that allow you to view the data from different perspectives and with different criteria. After changing an option, the chart will automatically update.
Here you'll learn how to:
- Categorize lanes by card status
- Exclude or include lanes
- Roll up lanes
- Set the date range
- Calculate based on card size
Categorize Lanes by Card Status
In the simplified Card Status view, lanes are categorized into Started, Not Started, and Finished sections:
- Not Started: The first overall lane of your board, and any lanes created within that first overall lane. Cards will be considered not started until they move out of this first overall lane.
- Started: Any lanes on your board other than the first overall (Not Started) lane, and the last overall (Finished) lane.
- Finished: The last overall lane on your board.
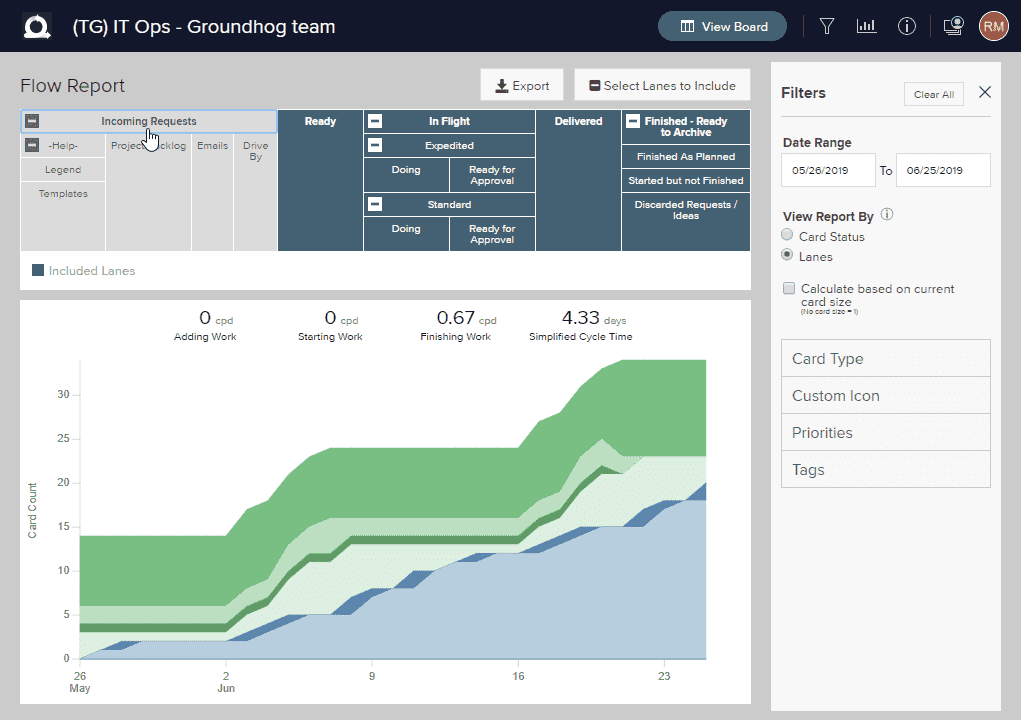
Exclude or Include Lanes
In the Lanes view, you can select specific lanes to include in the report. Click Select lanes to include above the Flow report to open a simplified representation of the lane structure on the board.
-
To exclude a lane from the diagram, click on the lane title. Deselected lanes will turn grey and will be excluded from the diagram.
-
To include a lane, click on the lane title of an excluded lane. Included lanes appear as blue.
-
To exclude or include all lanes within a parent lane, click the parent lane's title.
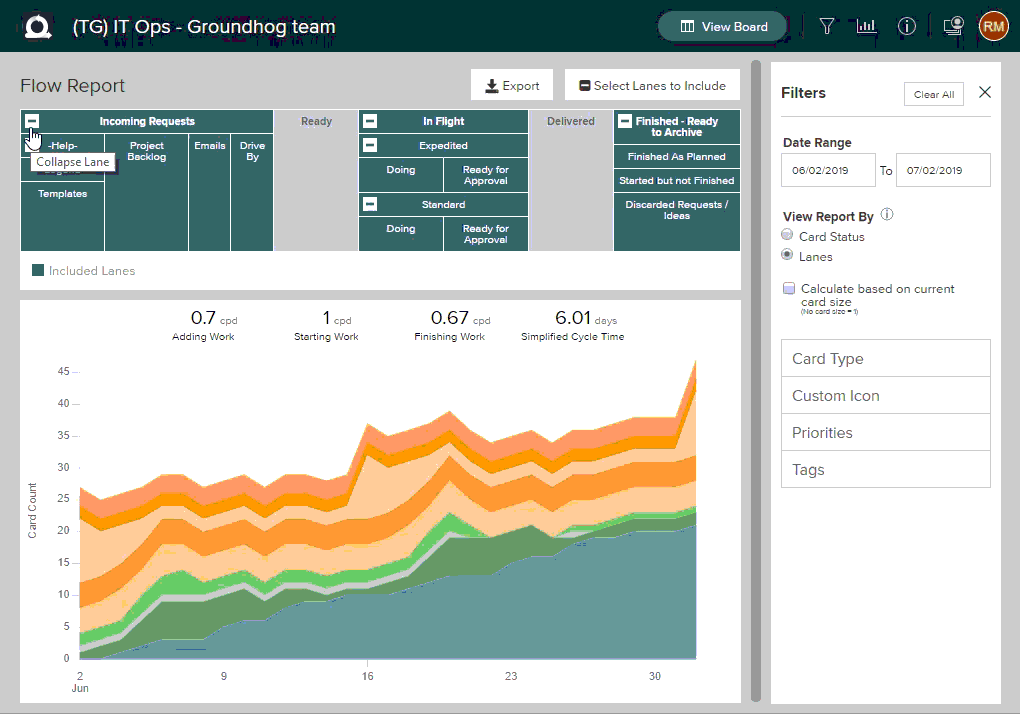
Roll Up Lanes
The work in progress calculations for child lanes can be aggregated into their parent lane by "rolling" up lanes in the Flow report.
-
To roll up lanes into their parent lane, click on the "-" in the parent lane header.
-
To un-roll lanes, click the "+" at the lane title.
Any of the child lanes can be rolled up into their parent lane at any level of the hierarchy.
Set the Date Range
You may focus on a specific date range using the date fields to the right of the the Flow report.
-
To set the start date of the Flow report, click in the left-most date box. Enter the desired start date in the box, or use the calendar that pops up to click on the desired date.
-
To set the stop date, click in the right-most date box. Enter the desired stop date in the box, or use the calendar that pops up to click on the desired date.
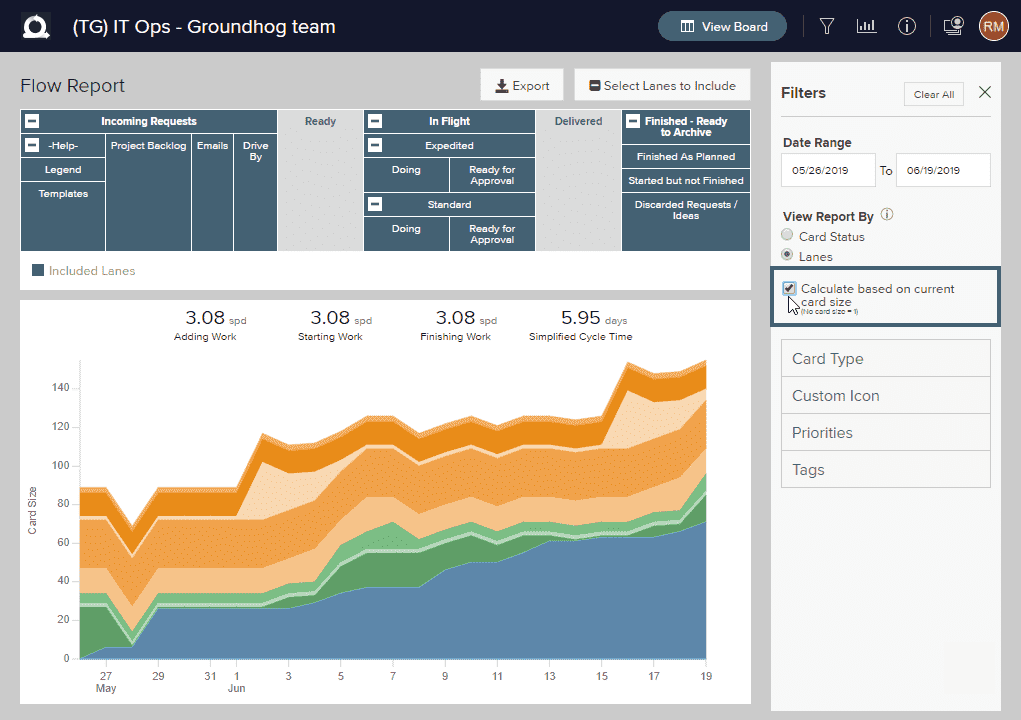
Calculate Work In Progress Based on Card Size
AgilePlace allows you to specify the size value within a card. These size values may represent any metric that your team uses to specify relative size of the work item. Size may mean hours, days, story points, complexity points, or whatever unit of measurement that your team finds useful.
If your team is using the size values to specify the relative size of each card, this metric may be more useful than the number of work items within a lane. For these situations, AgilePlace allows you to generate the Flow report based on the total size of the cards rather than the number of cards in the lane.
- To calculate work in progress based on card size, check the box Calculate based on Card Size.
NOTE
Any work items that do not have a size specified or have a size of 0 (zero) will be considered as a size of 1 (one) when calculating queue size.
Filter the Flow Report
Here you'll learn how to filter the flow report by:
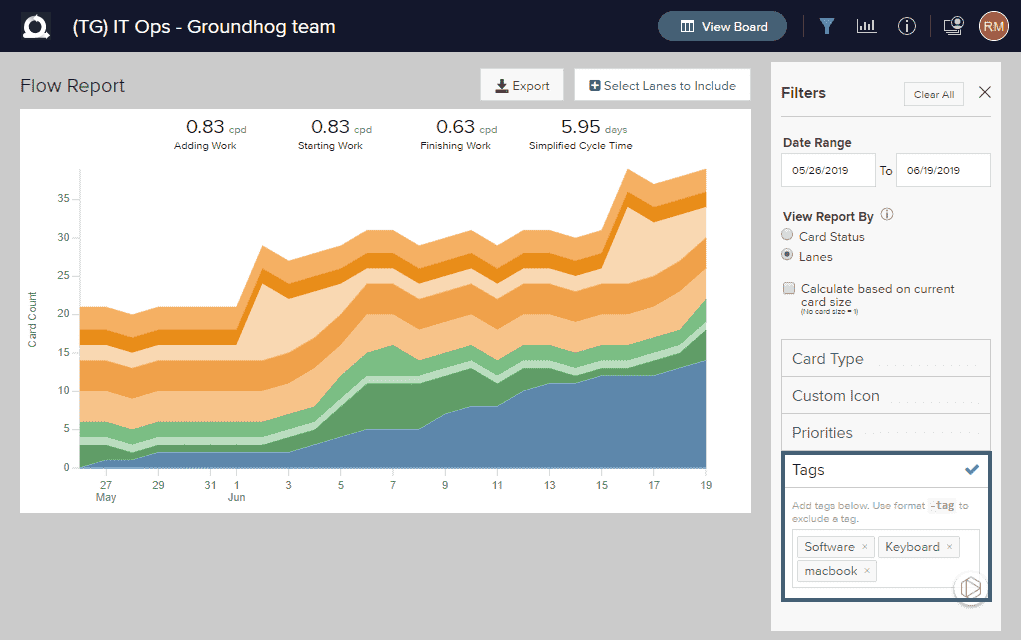
Filter by Card Tag
- To filter the Flow report by card tags, enter a comma-separated list of tags in the Tags box to the right of the diagram.
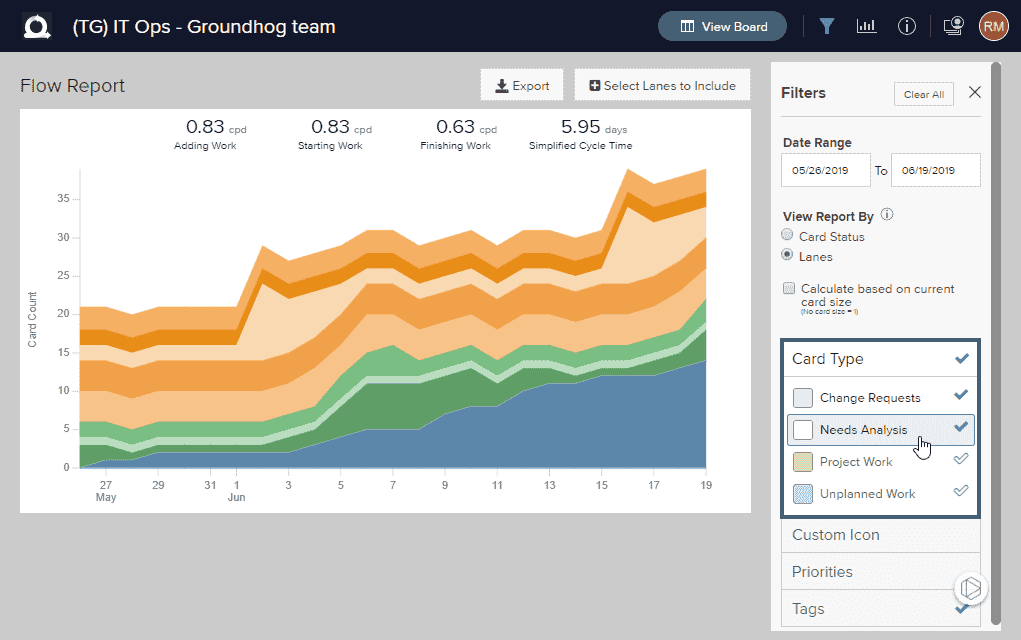
Filter by Card Type
To filter the Flow report by card type, click Card Type in the configuration panel to the right of the diagram. Select from the list of card types which ones to include in the diagram by clicking on them.
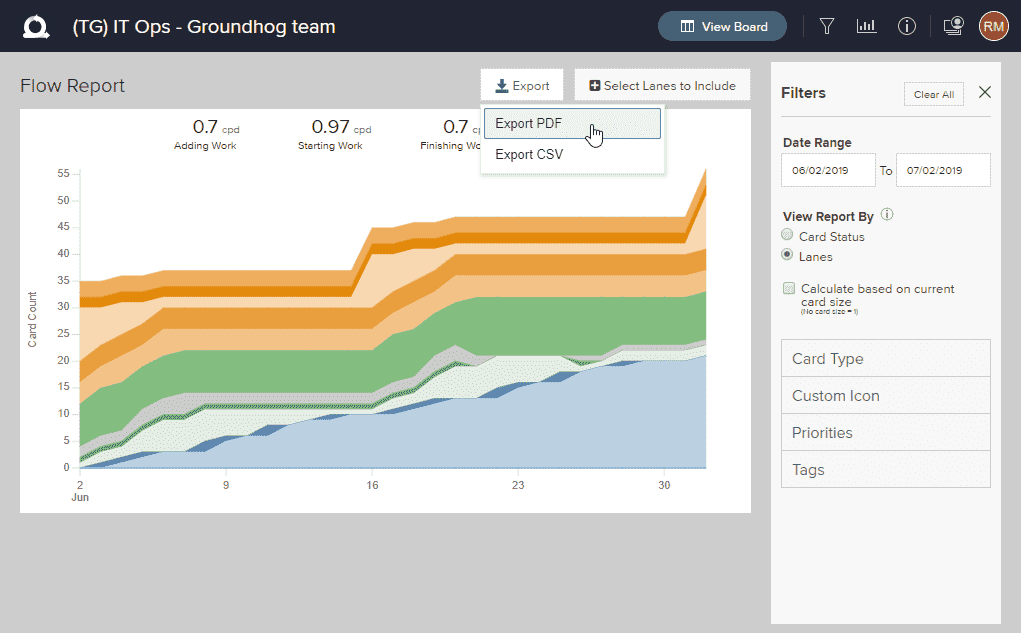
Export the Flow Report
To export the Flow report to PDF or CSV format, click the Export button and select the desired format.