
Project Portfolio Planning
Project Portfolio Planning
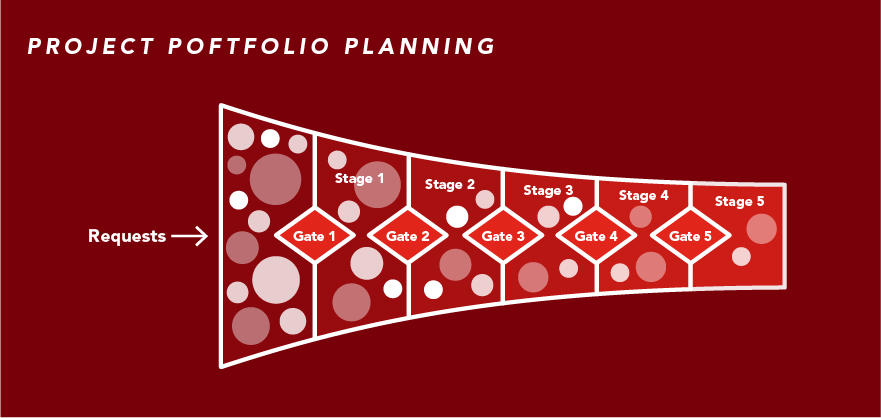
The Project Portfolio Planning capability’s enablers include Business Requests, Project Planning, and Project Governance. Each capability within the Planview Capability Framework has a distinct set of features and functionality, business processes, best practices, and analytics and reports that deliver value to customers in the form of specific business outcomes.
Enablers and Business Value
Business Requests
Supports a clearly-defined process to initiate business requests, including collecting relevant categorization or scoring information and initial financial data. Resulting business outcomes include:
- We have a single repository to collect requests from the business and this repository is available to all stakeholders in the organization for review.
- We have a structured process to categorize, assess, and carry out a sizing estimation of requests before taking them forward for consideration.
- We have a controlled and consistent process for reviewing and approving all work requests.
- We can ensure that request approval and review actions have been assigned to the appropriate users based upon specific criteria.
- We can ensure all appropriate actions and steps have been taken before requests are approved to progress.
Project Planning
Supports the creation of new work or projects and the entry of descriptive and categorization information. All work is centralized and can be tracked and reported on through various statuses. Resulting business outcomes include:
- We have a consistent intake process for all work.
- We have a single repository of all work, which includes new potential (not yet approved), approved, active, and completed work.
- We can describe and categorize work based on our organizational data model and attributes.
Project Governance
Provides a process and governance structure for progressing projects through an approval lifecycle into execution and delivery, ensuring that decisions are made by the right people and are based on structured data for each project entity. Resulting business outcomes include:
- We have a structured process to capture, assess, estimate, and approve projects.
- We can ensure that the appropriate governance process is applied to projects, based on specific criteria.
- We can control the progression of a project through the delivery process and ensure all appropriate actions and steps have been taken at each stage.
- We can ensure that approval and review actions have been assigned to the appropriate user.
- We have a governance model that supports assigning responsibilities within the workflow and retains an audit trail of reviews and approvals.
Best Practices
Simplify request submission
Managing requests can be messy, so optimizing the process can have a noticeable impact. Create a standardized form for requests, ensure that everyone has access to it, and keep all requests in the same place so that they are easier to manage in the evaluation phase.
Standardize request evaluation
Prioritizing requests is a difficult process. Utilizing a concise, objective set of criteria to rank and evaluate the requests eliminates the guesswork, alleviates the burden of having to choose, and lessens tension if requests are not approved.
Optimize post-review process
Once requests have been evaluated, it’s equally important to have a process in place to approve, deny, or send the request to the backlog. Make a simple, straightforward process for what happens in each case, with a single person to oversee them.
Templatize
Utilizing templates helps streamline and optimize processes. At the project planning level, it’s possible to create templates for nearly every step of the process, such as a project schedule template, a project charter template, or a project communication plan template.
Use minimal governance
Organizations can cut down on valuable time and resources by optimizing their governance processes with a streamlined and consistent “minimum viable governance” model. Project managers and teams must know where governance gates are and incorporate them into the planning process.
Mind your constraints
Constraints are factors that limit scheduling options, such as government regulation, customer deadlines, or internal policy, which usually come in the form of must-start or must-end dates. Understanding your constraints is a critical part of planning a successful project.
Always consider scope
Scoping is setting high-level estimates for the effort, time, and types of resources required to complete a project. Keeping scope in mind throughout the planning process will lead to greater success throughout the life of the project.
Processes and Reports
Project portfolio planning supports a clear and consistent process for initiating new business requests, managing new projects, and progressing projects through an approval cycle into execution and delivery. When new projects are created, description and categorization information is captured, then a high-level work schedule is built out with dates, durations, milestones, and other important information. A high-level estimate of project costs and benefits are captured in the financial plan, then baselined to track progress on project delivery, business outcomes, and important program milestones.
Video: Business Requests Demo
Business Requests Process Steps
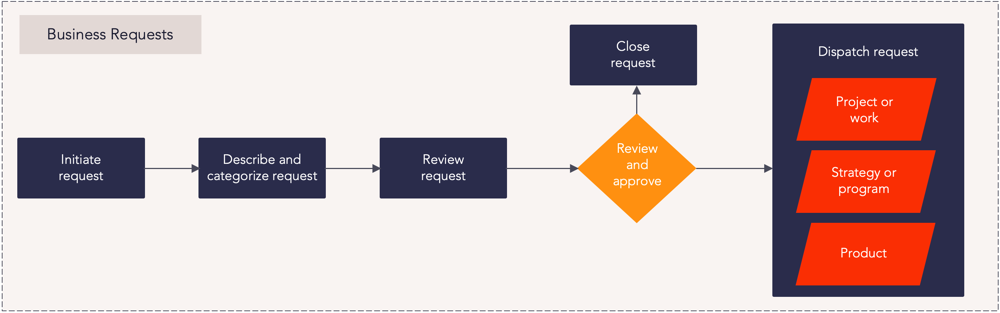
Business requests process flow
|
Process Step |
Description |
|---|---|
|
Initiate request |
Requests provide one way that new entities, such as projects, programs, products, can be initiated in Planview Portfolios. This allows incoming requests to be well-defined, categorized, and assigned to the right area for delivery. This also allows requests to be evaluated against each other to compare scoring, impacts, and alignment. When a new request is created, certain fields will be required to ensure the data needed for appropriate categorization is provided. Request assignment and any lifecycle steps will start following your defined governance process. For more information: |
|
Describe and categorize request |
During the initiation of a request, information is populated into Planview Portfolios to describe and categorize the request within the register. Often a minimum level of required categorization and descriptive information is enforced during the creation of the request via a lifecycle workflow to satisfy the specific data and information needs of the organization. For more information: |
|
Review request |
Once you have a request portfolio, you can see detailed information regarding the requests that are included in your portfolio on the Portfolio Manager tile within the Request Portfolio View screen. This will allow the request to be reviewed in preparation for dispatch. For more information: |
|
Dispatch request |
The purpose of this step is to connect the request with a relevant entity in Planview Portfolios. This can be achieved by either dispatching the request which generates a new entity or associating it with an already existing one. Planview Portfolios can route requests to a dispatcher, who is the user responsible for evaluating the requests and then performing the following tasks. Depending on whether your system supports request lifecycles, a dispatcher can perform those tasks through request lifecycles or from the Request View screen without the use of lifecycles. The dispatcher can:
A dispatcher can share dispatching responsibilities with other users. For more information: |
|
Close request |
If approval is not granted or the request is no longer needed, change the status to closed. This provides a record of its status for reporting and ensures that no further updates can be made to the request. Depending on the internal business process, the process to close the request can vary and may contain approval gates in a lifecycle workflow. In these instances, successful completion of the lifecycle steps by the relevant users will automatically close the Request. The status of the request can be changed in the Request Detail screen, or directly in the Portfolio Manager using an appropriate column set selection. For more information: |
Video: Project Planning Demo

Project Planning Process Steps
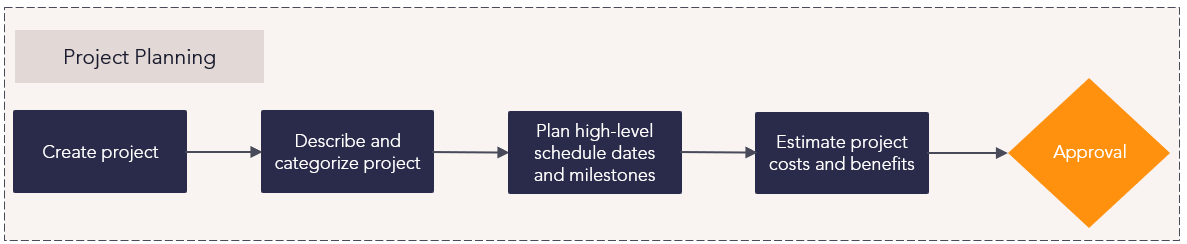
Project planning process flow
| Process Step | Description |
|---|---|
|
Create project |
A project is where work is planned, the is also known as the Primary Planning Level (PPL). It contains the breakdown of the work in the form of tasks, assignments, financial information, timelines, roadmaps, baselines, and other information needed for a project to be successful. When a new project is created, certain fields will be required to ensure the data needed for appropriate categorization is provided. Project assignment and any lifecycle steps will start following your defined governance process. For more information: |
|
Describe and categorize project |
During the creation process for each new project, relevant description and categorization information should be captured through a lifecycle-driven configured screen. Project attributes can be edited on the Work View screen of the project and can be viewed in the Work Portfolio view. For more information: |
|
Plan high-level schedule dates and milestones |
To form a high-level project schedule, you can build out the Work Breakdown Structure. As part of this step, you should also add dates, durations, dependencies, and initial resource assignments. The project schedule consists of any elements in the Work Breakdown Structure that exist below the project level in the hierarchy, such as phases, tasks, and activities as well as dates, durations, and categorizations. For more information: |
|
Estimate project costs and benefits |
Capture a high-level estimate of the costs and benefits to deliver the project in the work financial plan based on the need of your organization. Cost accounts can include labor, capital spending, and expense spending. For more information: |
Project Governance Process Steps
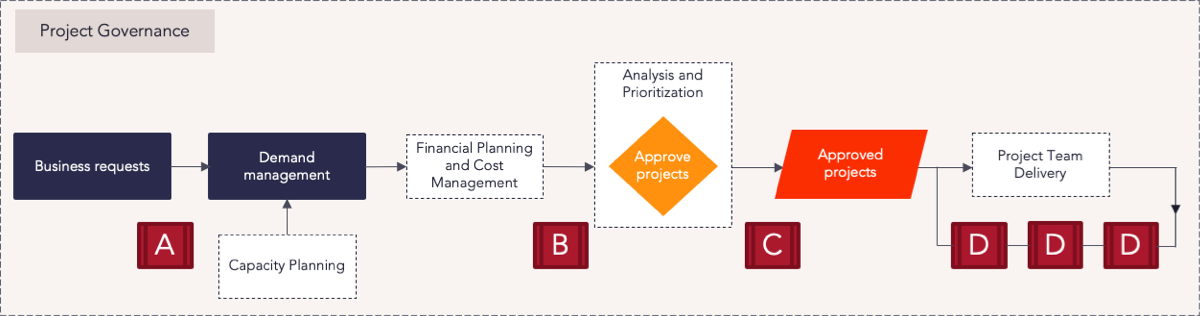
Project governance process flow
| Process Step | Description |
|---|---|
|
Governance point A |
Request intake information is reviewed. If approved, new projects or programs will be created. |
|
Governance point B |
Initial project planning information, such as description and categorization attributes, cost and benefit estimates, and roadmap dates, will be captured and reviewed to determine if enough is known to proceed with the project and include in the detailed portfolio planning process. |
|
Governance point C |
The process of investment planning allows planners to prioritize and analyze the list of proposed investments (projects) to determine which to move forward with. Analysis of investments is achieved by comparing what’s available, capacity (which can be in the form of resource capacity or financial a budget against what is required) versus demand (derived by the forecast of projects in the portfolio). Planners will create and compare a number of investment planning scenarios to model different investment decisions and various approaches to balancing investment demand with capacity. Once an approach is chosen, these decisions will be published as the agreed portfolio plan. |
|
Governance point D |
If required, projects can proceed through a gated governance process. Usually, each gate requires the project to comply with a checklist of activities/deliverables before proceeding to the next gate. |
Business Requests Process Steps
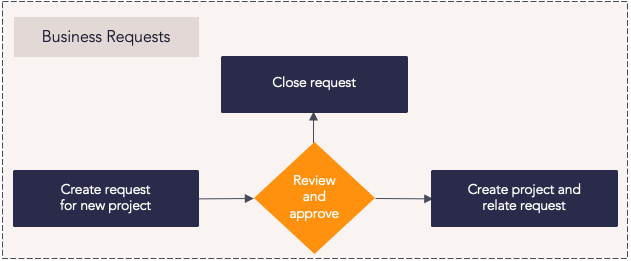
Business requests process flow
| Process Step | Description |
|---|---|
|
Create request for new project |
New project requests provide one way that project work can be initiated in Planview AdaptiveWork. It is an opportunity to ensure that the incoming work requests are well defined, categorized, and assigned to the right area for delivery. This also allows project requests to be evaluated against each other to compare scoring, impacts, and alignment. When a new request is created, certain fields will be required to ensure the data needed for appropriate categorization is provided. Request assignment and any lifecycle steps will start following your defined governance process. Relevant users will receive notifications via Discussions or email. Requests can be initiated from the Requests module, as well as using a web form or email. For more information: |
|
Submit request for approval |
The request must be assigned or reassigned to the relevant approval authority to gain approval from within your organization's governance structure. The users assigned may take an action to approve the request, seek more information, or reject the request. When taking an action, the owner of the request will be notified via Discussions. |
|
Convert to project |
Once the request has been approved, it may be converted into a project. The originating request and project will be related. The request owner and project manager will be notified via Discussions. |
|
Close request |
If approval is not granted or the request is no longer needed, close the request. This provides a record of its status for reporting and ensures that no further updates can be made to the request. |
Project Planning Process Steps
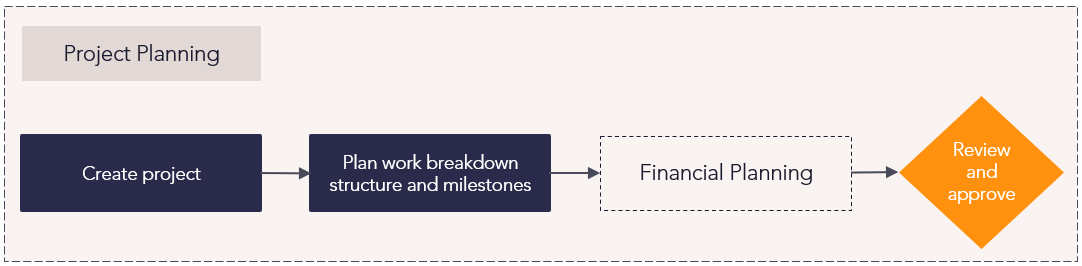
Project planning process flow
| Process Step | Description |
|---|---|
|
Create project |
A project is the basic level where work is planned. It contains units of work in the form of tasks, financial information, timelines, roadmaps, baselines, and other information needed for a project to be successful. New projects can be converted from new project requests or by creating a new project in the Projects module. When a new project is created, certain fields will be required to ensure the data needed for appropriate categorization is provided. Project assignment and any lifecycle steps will start following your defined governance process. Relevant users will receive notifications via Discussions and/or email. For more information: |
|
Plan high-level schedule dates and milestones |
Building out the Work Breakdown Structure allows a Project Manager to form a high-level project schedule. As part of this step, you should also add dates, durations, dependencies, and initial resource assignments. The project schedule consists of any elements in the work breakdown structure that exist below the project level in the hierarchy, such as phases, tasks, and activities as well as dates, durations, and categorizations. For more information: |
|
Estimate project costs and benefits |
In this step you can capture a high-level estimate of the costs and benefits to deliver the project in the work financial plan based on the need of your organization, cost accounts can include labor, capital spending, and expense spending. For more information: |
|
Review and approval |
Once the project has a schedule, roadmap, and financials in place, the final step is submitting your project to the relevant governing body for review. Once approved, the project's lifecycle state should be updated from draft to active, which will also activate all of the tasks living within the project. For more information: |
Project Governance Process Steps
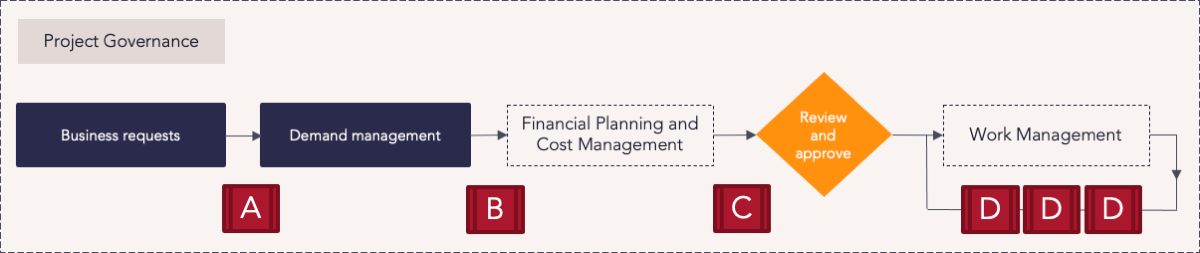
Project governance process flow
| Process Step | Description |
|---|---|
|
Governance point A |
At this potential governance point, the request intake information is reviewed and, if approved, new projects or programs will be created. |
|
Governance point B |
At this potential governance point, the initial project planning information, such as description and categorization attributes, cost and benefit estimates, and roadmap dates, will be captured and reviewed to determine if enough is known to proceed with the project. |
|
Governance point C |
At this potential governance point, the project goes through a process of analyzing proposed investments (projects) to determine which to move forward with, typically based on resource capacity and finances. For more information: |
|
Governance point D |
If required, projects can proceed through a gated governance process. Usually, each gate requires the project to comply with a checklist of activities/deliverables before proceeding to the next gate. For more information: |
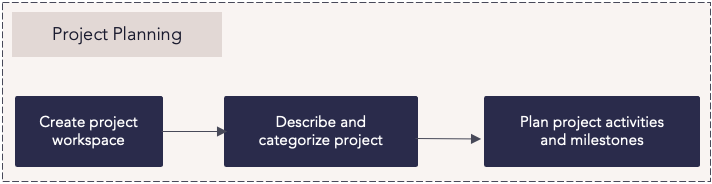
Project Planning Process Flow
Project planning process flow
| Process Step | Description |
|---|---|
| Create project workspace |
Workspaces allow you to plan your project or work to be done and follow up as the project progresses. Create a workspace from a workspace template with a predefined structure, or create a blank workspace. Connect the workspace to scheduled project dates and targets to provide relevant project details at a glance. |
|
Describe and categorize project |
Administrators define workspace settings within the Administration tool. Relevant project details and categorization information are captured during the workspace setup. Administrators can add custom fields to the workspace for additional data. |
| Plan project activities and milestones |
Using the Plan tool, build a project schedule into a work breakdown structure by adding activities and milestones. Connect Boards to the plan to manage the progress of all activities and their associated cards. The project timeline can also be displayed as a Gantt chart, subject to the working days defined when the workspace was created. |
NOTE
Customers will need to enable the Portfolios to ProjectPlace connection to support Business Requests and Project Governance in ProjectPlace.
Related Capabilities
Work Management
Develop a work plan, manage project delivery, and report on project status and health.
Read moreResource Management
Track and manage resource assignments and forecast future demand.
Read moreProject Team Delivery
Collaborate in a workspace with integrated Kanban boards and centralized document management.
Read more
Supported Solutions