OKR Progress widget
Description
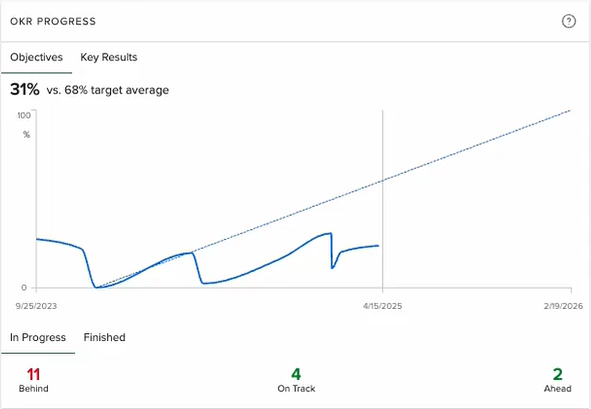
The OKR Progress widget displays an interactive line graph of the progress of objectives and key results over a fixed timeframe.
OKR Progress widget
Available functionality
Objectives and Key Results tabs
The Objectives tab displays the percent complete of your objectives (objectives that you have access to view) over the timeframe. You can click spots along the timeframe to view the values at specific dates.
The Key Results tab displays the same information as the Objectives tab, but includes only the key results.
To view objectives that are in progress:
- Click the In Progress tab at the bottom of the widget.
- To view the objectives that are behind, on track, or ahead of schedule, click the corresponding number value. The list of objectives for the option you selected appears.
- Do any of the following:
- To view the key results for the objective, click the objective row.
- To view the activities, click the key results row.
To view finished objectives:
- Click the Finished tab at the bottom of the widget.
- To view the objectives that finished below target, on target, or over target, click the corresponding number value. The list of objectives for the option you selected appears.
- Do any of the following:
- To view the key results for the objective, click the objective row.
- To view the activities, click the key results row.

How-to video
Configuration settings
| Option | Description |
|---|---|
| Title | Read-only. Name of the roadmap selected below. |
| Description (contextual help) | Description to appear when user clicks the help icon for the roadmap. |
| Timeframe |
Time range to be displayed:
|
| OKRs to show |
Option for specifying the OKRs to be included:
|
|
From To |
Appears when Custom is selected for the timeframe, above. Specifies the time range to be displayed. |
| Add OKR source |
Option for specifying the source type:
You can select multiple sources and source items. |
| Boards | Appears when Board is selected for the OKR source. You can select one or more boards from AgilePlace. |
|
Strategy |
Appears when Strategy is selected for the OKR source, above. You can select one more more strategies from Portfolios |
| Work | Appears when Work is selected for the OKR source. You can select one or more work entities from Portfolios |
| Levels | Multi-select list of levels to appear on the widget |