Bottleneck Finder
Introduction
The Bottleneck Finder uses Viz’s built-in expertise to analyze your data and pinpoint the bottlenecks in your process — so you can see where your work is slowing down and piling up.
There are several types of bottlenecks:
- Resource scarcity
- Lack of automation (e.g., CI/CD pipelines, testing)
- Process timing (e.g., funding approvals, end-to-end testing, waiting for change approval)
- Dependencies
Note: If you'd like to learn more about these bottlenecks, see the coaching videos below.
Getting Started with the Bottleneck Finder
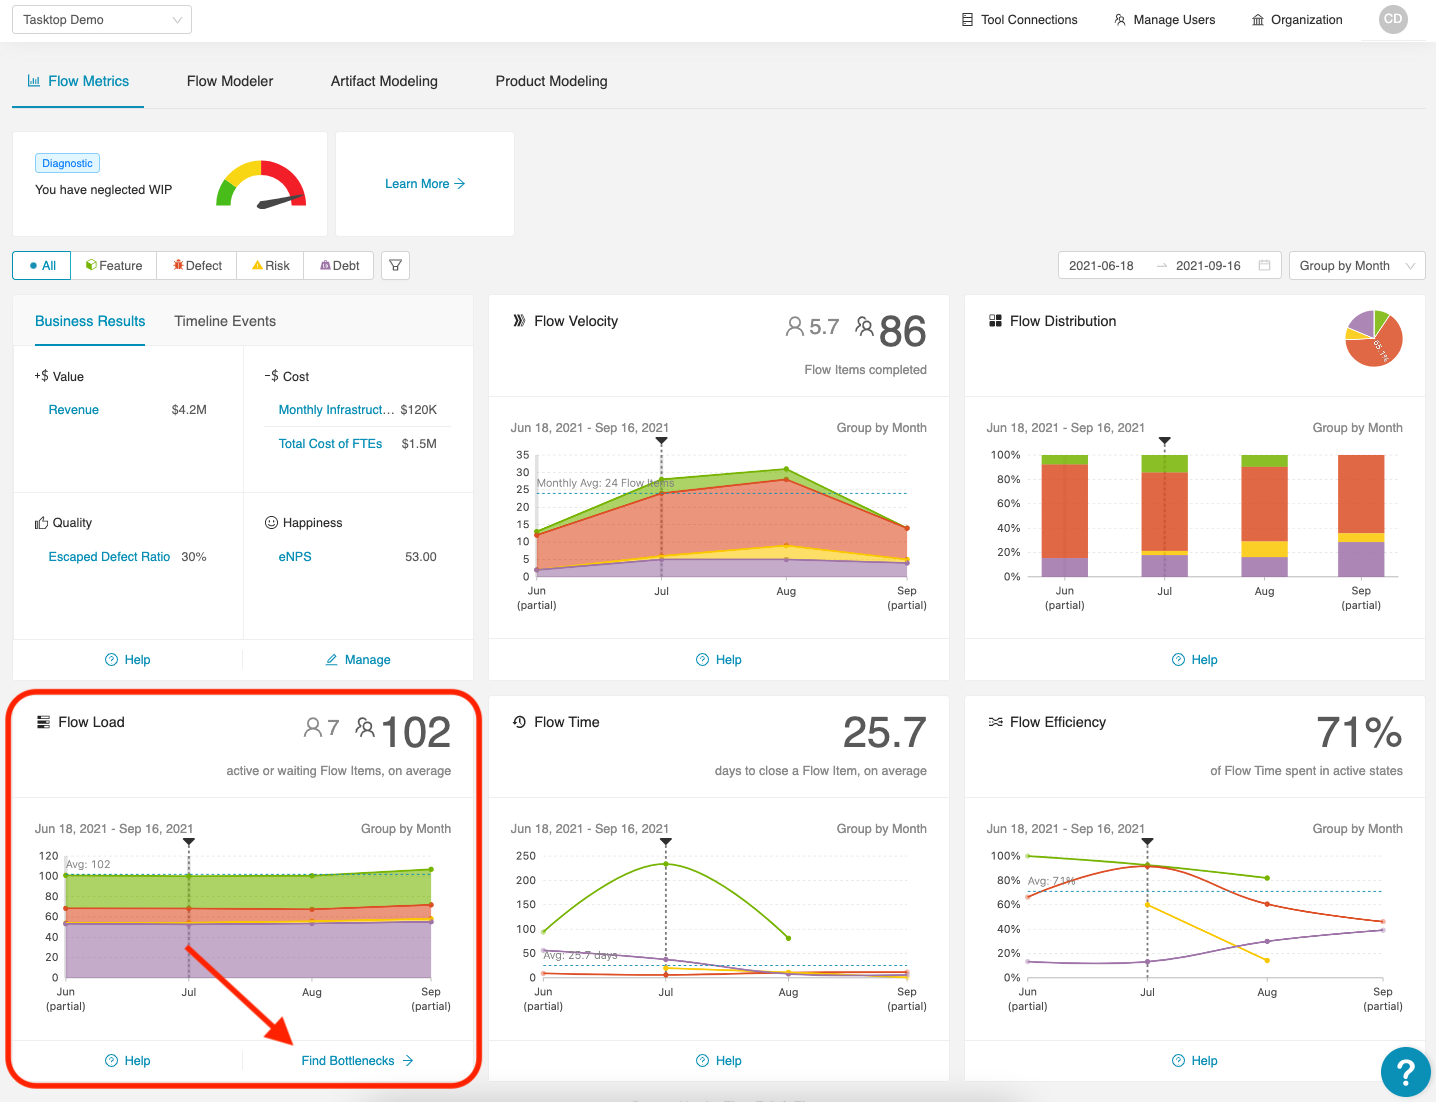
To access the bottleneck finder, click Find Bottlenecks on the Flow Load® card.
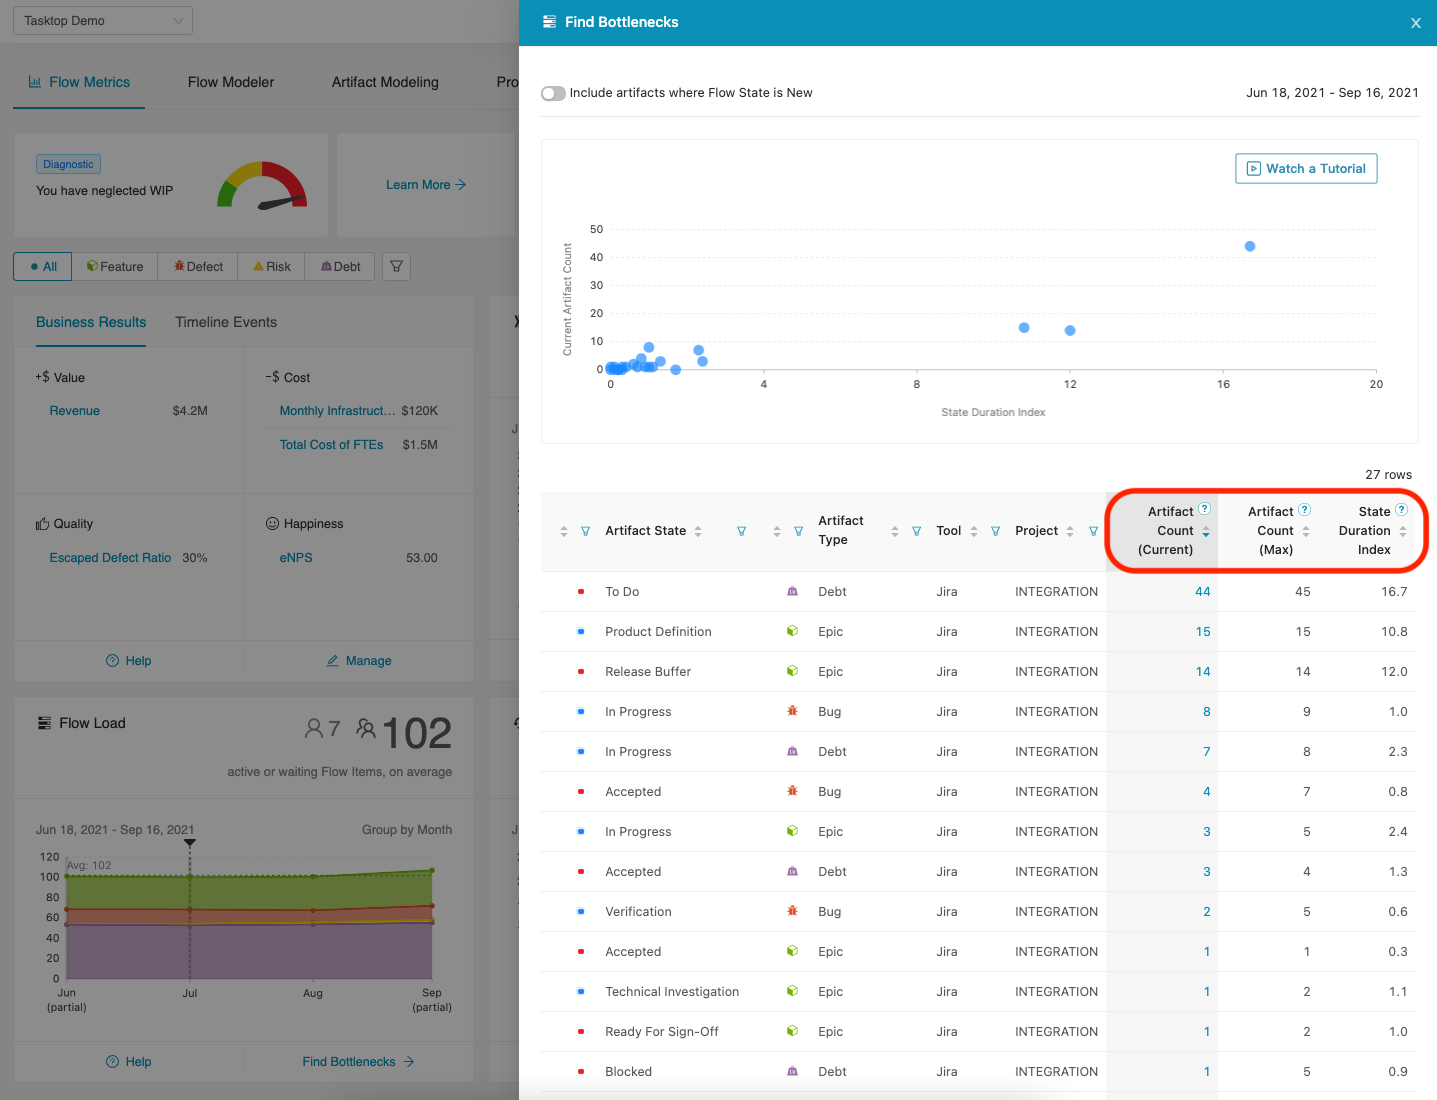
You’ll then see the Find Bottlenecks drawer — which includes values for current artifact count, max artifact count, and state duration index.
- Current Artifact Count represents the current number of artifacts in each state, as of the most recent polling by Viz.
- Max Artifact Count represents the maximum number of artifacts in each state at any time during a specified date range.
- State Duration Index allows you to compare the relative amount of time artifacts spend in each state.
These values can be used to compare the number of resources available to perform work in a particular state — determining how active work truly is in that state.
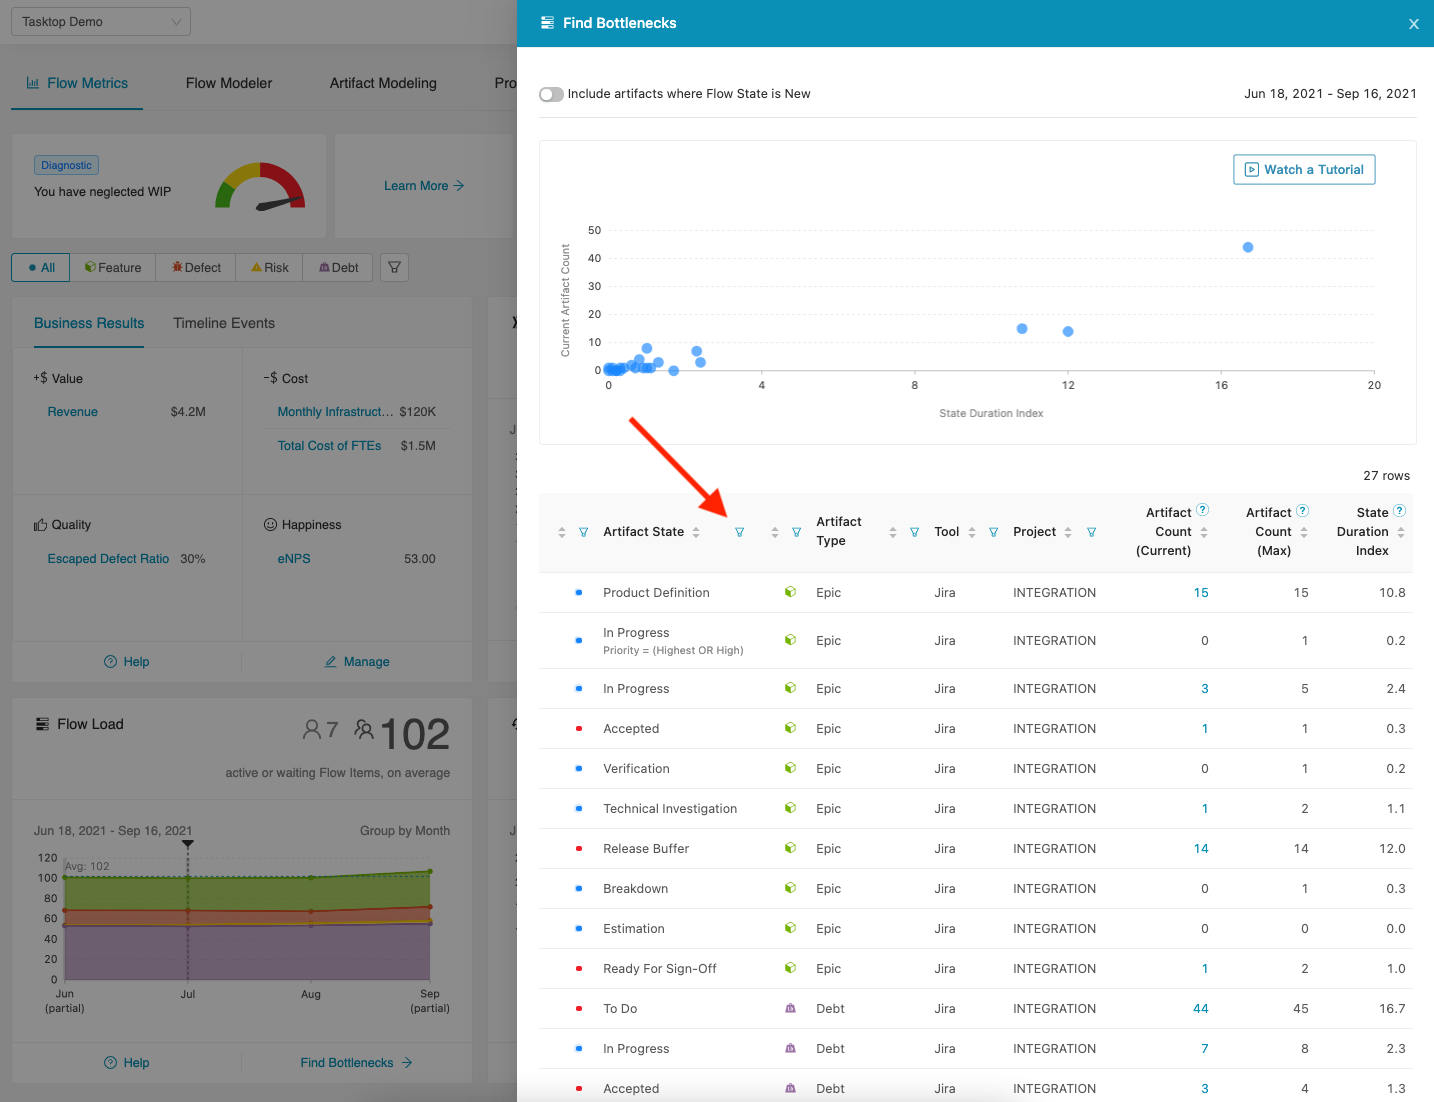
You can use filters to sort by flow state, artifact state, flow item, artifact type, tool, or project.
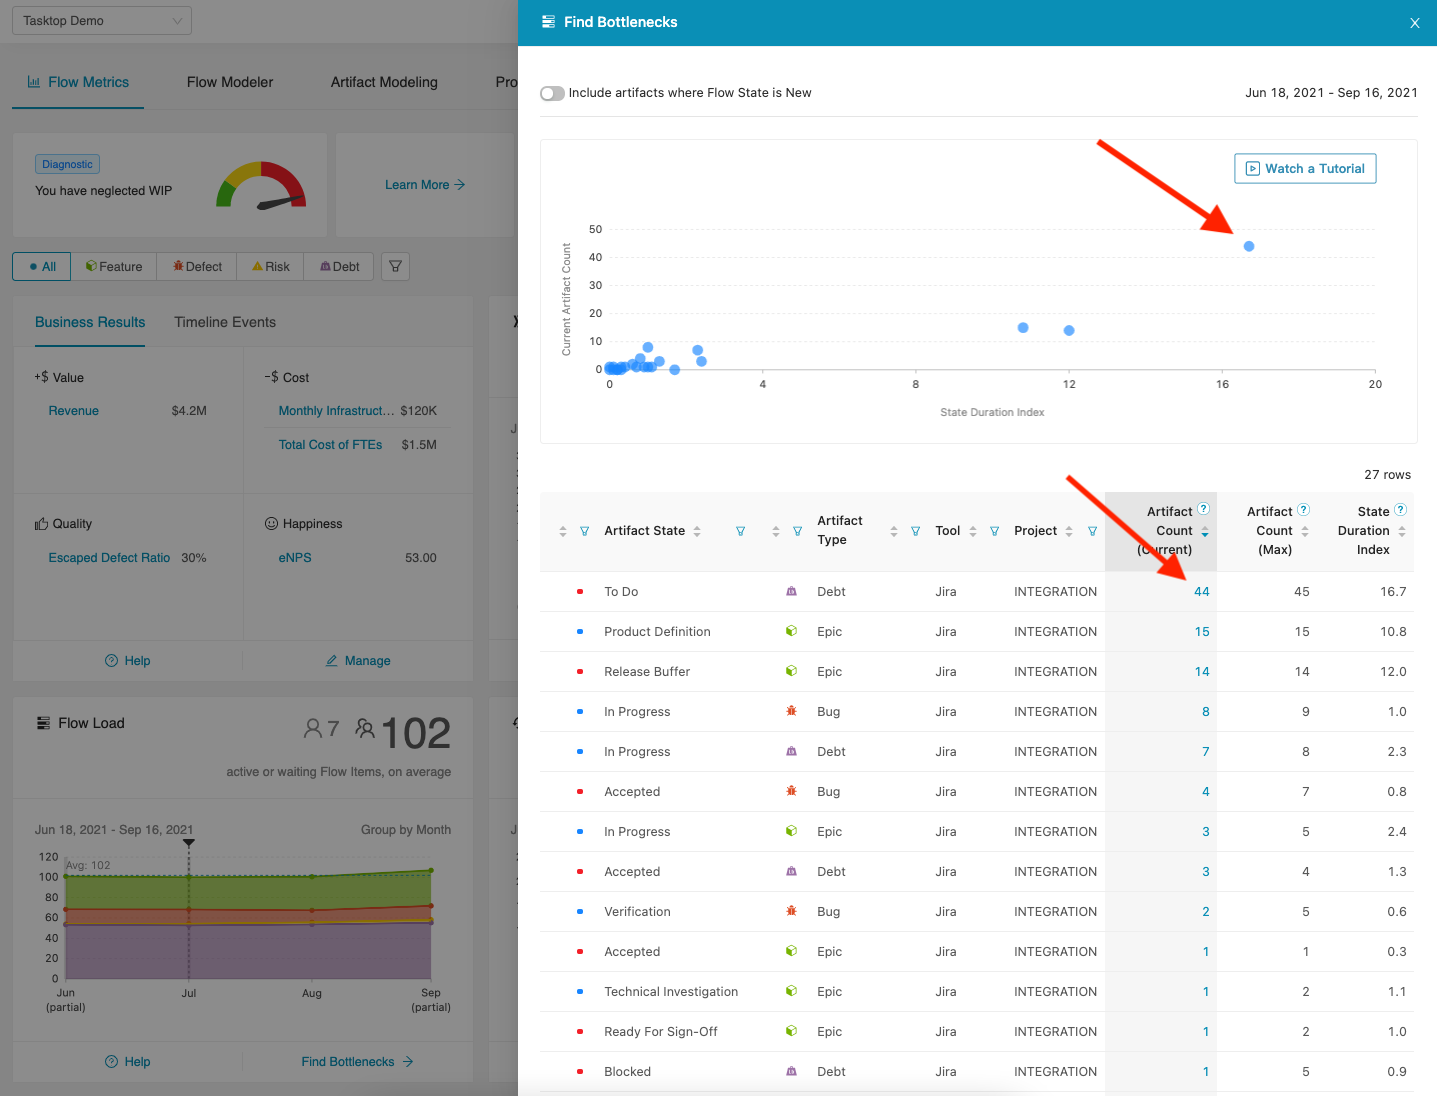
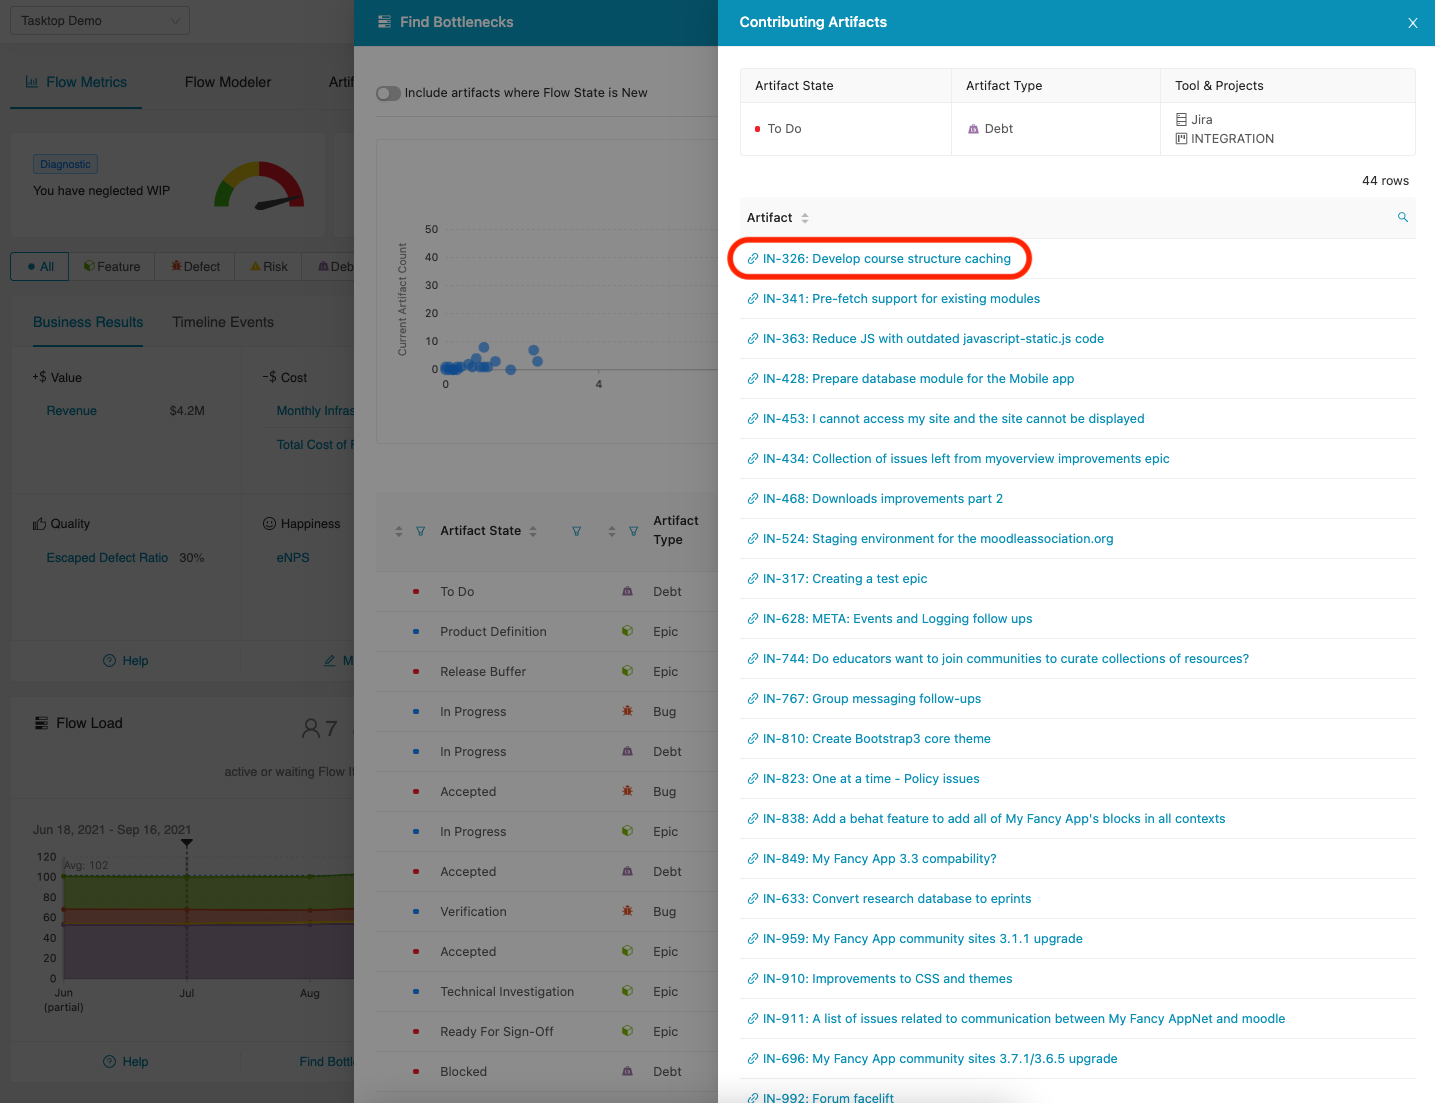
To better understand your Flow Metrics and validate the data pulled into Viz, click a value in the Current Artifact Count column to see the contributing artifacts for each modeled artifact, or simply click the artifact in the chart.
On the Contributing Artifacts screen, click the link on an individual artifact to view the artifact within the external tool itself (assuming you have credentials with appropriate permissions).
Coaching Tutorial
You can learn more about how to identify four common bottlenecks and how to solve them in the coaching videos below.
