Access/Insights Page Sections
Introduction
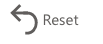
The standard reports can be accessed from within the Insights tab that is located on the Dashboard page of each challenge or community. Access to this page can be controlled and you can read more about that in this article: Reporting: New Analytics Integrations. The Insights page itself is embedded within a IdeaPlace page and has four distinct sections.
Figure 1 - Embedded UI Overview
Folder System
The red box on left side of figure 1 shows the access point for folders and reports that are saved within the workspace. To read more about managing folders and reports, please visit this article: Reporting: New Analytics Integrations.
Report View
The central section marked in yellow is the report and visualization viewing area of Insights. This section is where users add visualizations and tabs for additional visualizations within the report.
Report Menu
Highlighted in blue, this section is a drop down which shows options relating to Insights and Power BI Embedded. Users holding the Report Creator role will see four options in the dropdown: View, Edit, Create, and Manage.
Filters
The filter section which is highlighted in green in figure 1 is expandable and displays the filters that are available within the report tab that is being viewed currently. These filters match the filters that are available via the report page and are split between visualization, page, and all page-specific filters.
To access the filters in the report panel, simply click the hamburger menu. ![]()
To collapse the filters panel, click the Back button. 
To reset the filters on the current page and all pages, click the Reset button.