
STR42 - Strategy Process Analysis - Strategy Status
- STR01 - Strategy/Program Portfolio Details
- STR02 - Strategic Portfolio Balance
- STR03 - Strategic Portfolio Prioritization
- STR08 - Strategy Portfolio Associated Change Requests
- STR09 - Strategy Portfolio Associated Risk
- STR11 - Strategy Portfolio Associated Issues
- STR31 - Strategic Portfolio Cost and Benefit Analysis
- STR32 - Strategic Portfolio Financial Performance
- STR33 - Strategic Initiative Pipeline Matrix
- STR34 - Strategic Portfolio Investment Risk and Reward
- STR41 -Strategy Process Analysis - Lifecycle Stage
- STR42 - Strategy Process Analysis - Strategy Status
- STR43 - Strategy Process Analysis - Investment Approval
- STR51 - Strategy Portfolio Associated Work Matrix
- STR53 - Work Portfolio Balance Dashboard
- STR54 - Strategic Portfolio Dashboard
Strategy Portfolios: For More Information
step 12 of 16
- Last updated
- Save as PDF
Overview
Strategy/program portfolio report showing data on program status to aid analysis on throughput, volume and cycle time. Report can be run against and sliced by different attributes.
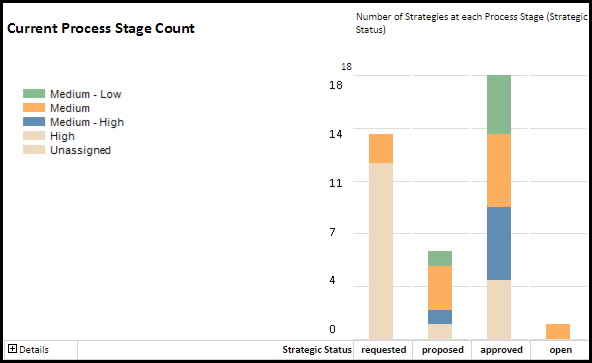
Strategy Process Analysis - Strategy Status example
Business Outcomes
- Supports the tracking of performance in terms of volume, throughput and cycle times for programs through the program lifecycle.
- Provides data to support the optimization of the program lifecycle process.
Supporting Capabilities
- Strategic Planning
- Governance and Lifecycle
Administration: User Parameter Configuration
| Parameters | Description | Configuration Options | Default/Example Settings |
| Report View | Determines the default view of the report. | A value of 0 (Dashboard) will show the charts but will collapse all the details. A value of 1 (Chart + Summary) will expand the summaries but keep the details collapsed. A value of 2 (Chart + Details) will render a fully expanded report. The “Dashboard” selection (report_view=0) will also hide the detail table. | report_view=0 |
| Table Format | Defines how the detail table at the bottom is formatted | The value “sectiongroup” renders a table with grouping, whereas “plain” renders a table that’s good for analysis in Excel. Neither of these apply when the report view is “Dashboard” because the table is hidden. | table_format=sectiongroup |
| Range start | This parameter determines the start of the range of dates that are preselected | The value represents the number of months from the current month. So a value of zero (0) represents the current month. A value of -11 would be 12 months ago. | horizon_start=-11 |
| Range end | This parameter determines the Finish of the range of dates that are preselected | The value represents the number of months from the current month. So a value of zero (0) represents the current month. A value of -11 would be 12 months ago. | horizon_finish=0 |
| Attribute for Grouping | Attribute used for slicing in the report | Only alternate structure attributes in the framework, marked as analyzable and that have charting colors assigned can be used for slicing in the report. | slicer=sps2_strategy |
Administration: Hidden Parameter Configuration
| Parameters | Description | Configuration Options | Default/Example Settings |
| Table Columns | Report supports 3 required/grouped columns plus 3 optional columns. | First three configurable values display grouped columns | sbs_level_3_strategy sbs_level_4_strategy psstatus_strategy |
| Analyze attribute | Attribute for which process cycle times are being measured. | analyze_attribute= spsstatus_strategy | |
| Filtered Attribute | Configured value defines structure codes of analyzable attribute values (leaf entries) that are to be included in the analysis. | Multiple entries are expected; one for each value to be included. A blank entry means all values are analyzed | The default configuration is a single, blank entry |
| Report Title | Configurable report title that appears at the top of the report. | If a longer report title is required, then create additional report_title=xxx entries and these will be concatenated together based on the order in which they are listed in the configuration structure. | report_title=Strategy Process Analysis-Strategy Status |
Additional Information
- The short names associated with charting colors for the attribute of lifecycle role drives the abbreviated value used in the charts.
- Recommendation: the first value of the Lifecycle Stage attribute should be set via an auto scripted dialog at project initiation not based on the default value that exists in the structure definition.
Technical/Database Information
| Report (RDL) Location | …/Reports/RPM/Strategy_RPM/RPM-STR42/RPM-STR42_v2.rdl |
| Database | This report uses the transactional database and updates will be real-time. |
| Report Developer Info: | RPM-STR42_v2 RDL is a derivative of the PROCESS01 RDL |