Contains all idea activity visualizations for each challenge. These visualizations are constructed using the core elements of the idea dimension and do not, out of the box, show any custom dimensions such as custom idea template fields or user dimensions related to ideas (i.e., department of the idea owner etc.).
Ideas Report example
Business Outcomes
Coming soon
Supporting Capabilities
Coming soon
Report Details
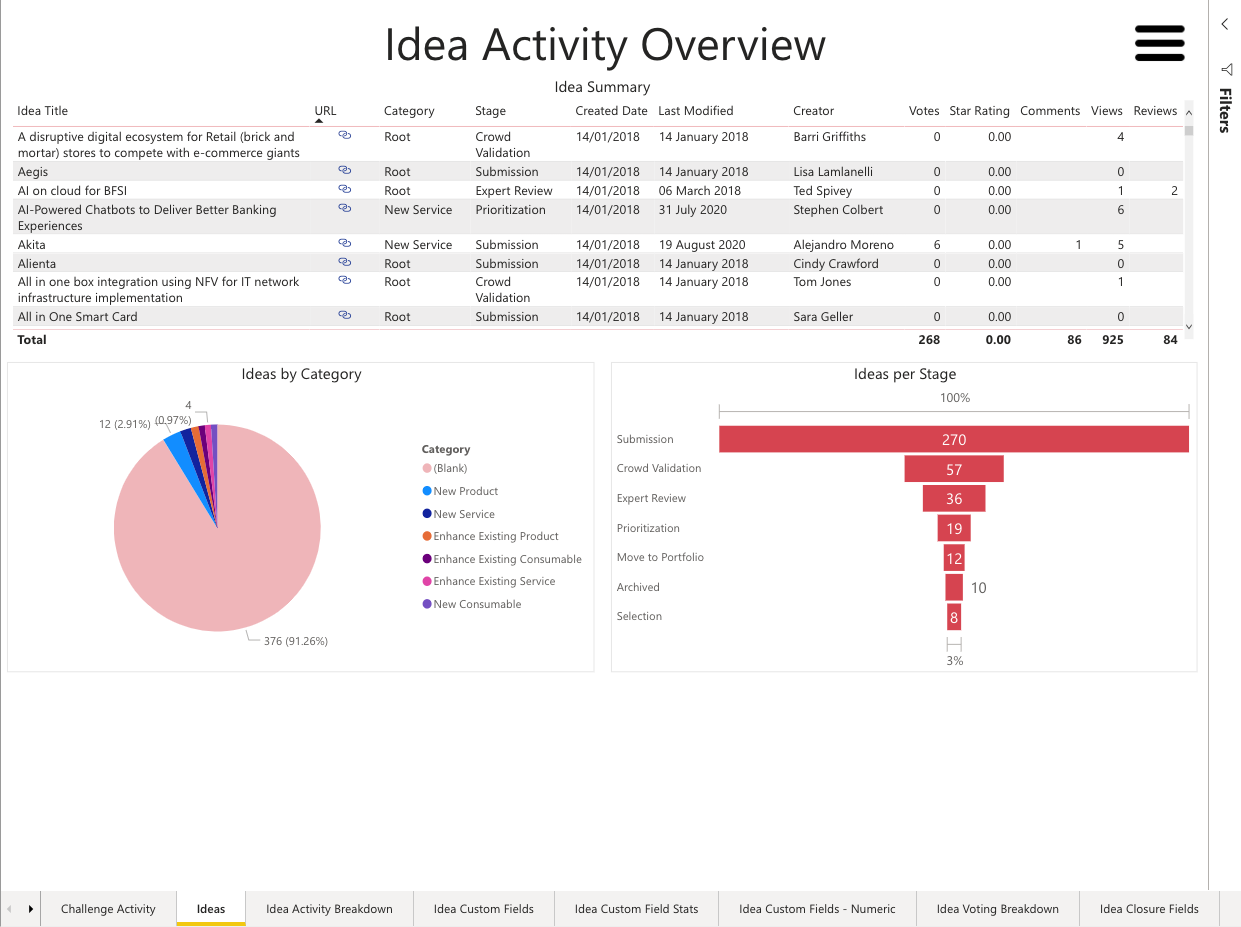
Idea Summary
This table contains the key idea details including Title, URL (clickable), Category, Stage (current), Created Date, Last Modified Date, Creator Name, Vote Count, Star Rating Average, Comment Count, View Count, and Review Count.
Ideas by Category
This segments ideas by the category that they are in. The chart will split to represent the count of ideas and their equivalent percentage. Should categories not be in use, this will display a Blank title in the legend.
Ideas per Stage
This new visualization offers a funnel view of ideas by stage. The visualization shows count of ideas and the hover tip shows a percentage breakdown. Please note that the visualization will display in order of idea count rather than stage order by default. Amendments can be made via the format icon.