
RPM Dashboard STR103 - Strategic Planning & Analysis Detail

Overview |
|---|
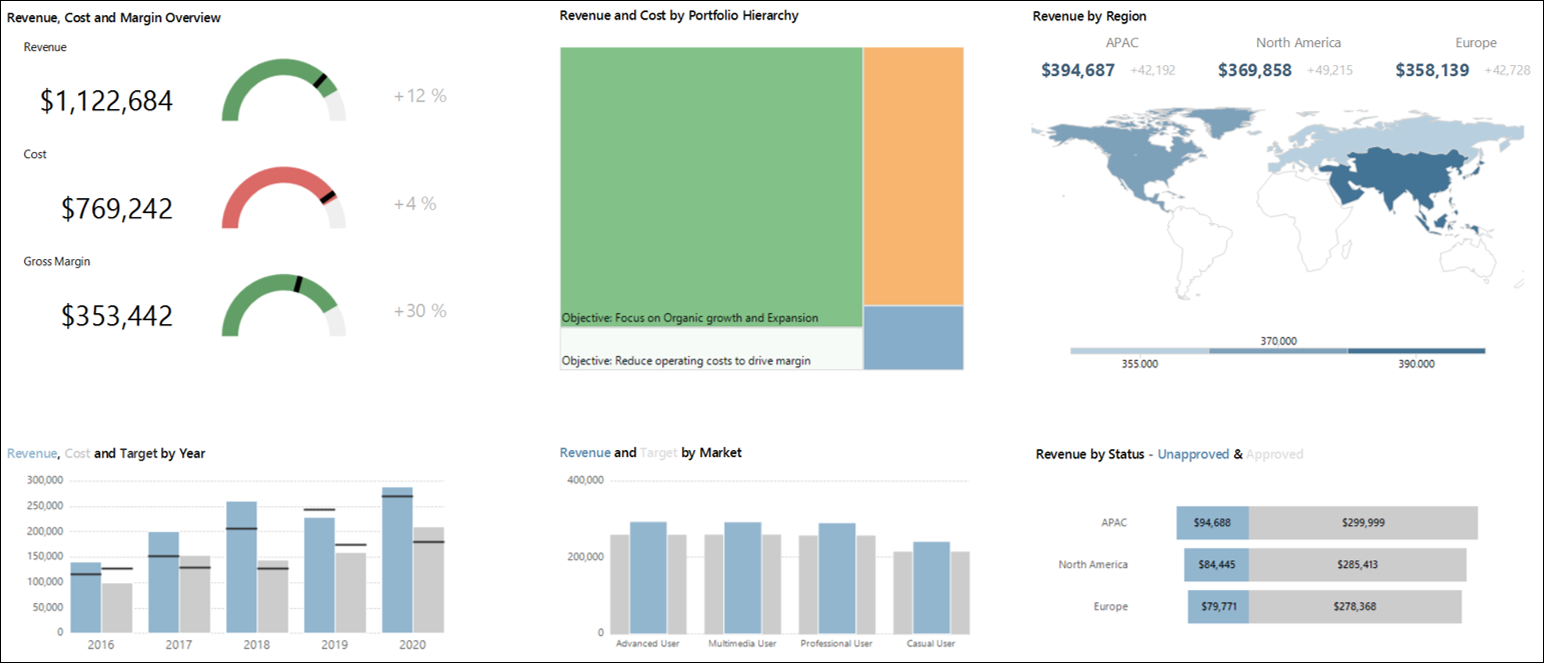
| The Strategic Planning and Analysis dashboard empowers strategic and program managers to quickly assess their strategic plans against targets and across key factors. Managers can immediately visualize whether the latest plans meet revenue, cost and margin targets. They can analyze cost and revenue breakdowns by missions and objectives, geographic regions, and markets. Evaluating performance against targets, incoming pipeline by region, and return by market, managers adjust their plans to deliver a balanced portfolio across their strategies. This dashboard can be used on either a strategy or planning portfolio ribbon. When used on the planning portfolio, the planning portfolio definition MUST be based on strategy |
| Click on a section of the example screenshot to view detail |
| Business Outcomes | Supporting Capabilities |
|---|---|
|
|
Business Rules |
|---|
| When run against a strategy portfolio, data will be classified as "Approved" if it is "Accepted" or "Conditional" - everything else will appear as "Unapproved" When run against a planning portfolio, only data that is above the line will be included. So that data will be classified as "Accepted" or "Conditional" (replacing, respectively, "Approved" and "Unapproved"). The "Revenue by Status" widget will now reflect these new classifications in the planning portfolio. It will be based on the the customer selection for the Investment Approval (OpCapAppr) SequenceID values of WBS27$ACTP and WBS27$COND (in the case these values are renamed). |
Key Financial Performance Indicator Fuel Gauges |
Back to Top ↑ |
|---|---|
| The Fuel Gauge Indicators highlight the performance of the strategic portfolio using data from the Financial plan.
The data displayed will respect the current driller selection of the tree map. |
|
Portfolio Hierarchy Tree Map |
Back to Top ↑ |
|---|---|
| This Portfolio tree map is based on the strategic hierarchy in the strategy breakdown structure. The color and size of the boxes allow analysis of further dimensions, showing Revenue and Cost
|
|
Revenue by Region |
Back to Top ↑ |
|---|---|
| This Revenue by Region Chart takes financial data from the demands (programs) financial plan where the account type revenue has Region as a line attribute. The chart visualizes the spread of this regional financial data on to an image map which can be customized to the appropriate scale and location The numerical values shows regional Target vs. demands data |
|
Time Phased Analysis |
Back to Top ↑ |
|---|---|
The Time Phased Analysis chart shows Revenue and Cost from the demand (program) level data in the financial plan by period.
The periods used in this chart are driven by the 'Aggregate Financials by' user parameter. |
|
Attribute Analysis |
Back to Top ↑ |
|---|---|
| This attribute for analysis chart shows revenue and target financial data sliced by an attribute. The 'Attribute for Analysis' user parameter is used to determine the selection for the slicing attribute. |
|
Investment Status Analysis |
Back to Top ↑ |
|---|---|
The Revenue by Status analysis chart provides a breakdown of revenue by investment status approval for each region.
|
|
Report User Parameters |
|
|---|---|
| The Report should execute with default User Parameters values configured by the administrator. To change a default value, select the 'Show Parameters' Click View Report to re-run the report with the new selection. |
|
| Parameters | Description |
| Currency | This parameter sets the display currency for the report. It is only possible to change currencies in a multi-currency environment. The parameter defaults to the users currency in Financial preferences. |
| Aggregate Financials By: | This parameter determines the period of time that financial and effort information will be broken down by in the report Possible values are:
|
| Analytic allows selection of two FM versions that are used for calculations. Parameter can be adjusted to compare different versions. |
|
| Target FM Version: | Analytic allows selection of two FM versions that are used for calculations. Defaults to versions marked as forecast and marked as baseline. Can be adjusted to compare to (for example) compare to a different baseline. |
| Attribute for Analysis: | This parameter defines the attribute that is used for the Time phased Analysis visualization (bottom middle) |