
Time-phased Resource Utilization and Financial Reports
Introduction
Use Time-phased resource utilization and financial resource reports to better understand past resource utilization and financials, analyze trends, and forecast future resource utilization and budgets.
The reports display data by time period, for your teams and team members.
Use the reports to:
-
View target vs actual utilization for teams and individual members (planned vs actual work)
-
Forecast work, cost and revenue
-
Analyze the data to see what resources are working on
The reports use data from the following items
-
Project and task assignments from the resource link (the user-Work Item link)
-
Capacity as defined in user calendars
-
Actual work as recorded in timesheets
-
Financial metrics for labor based on hours * rates
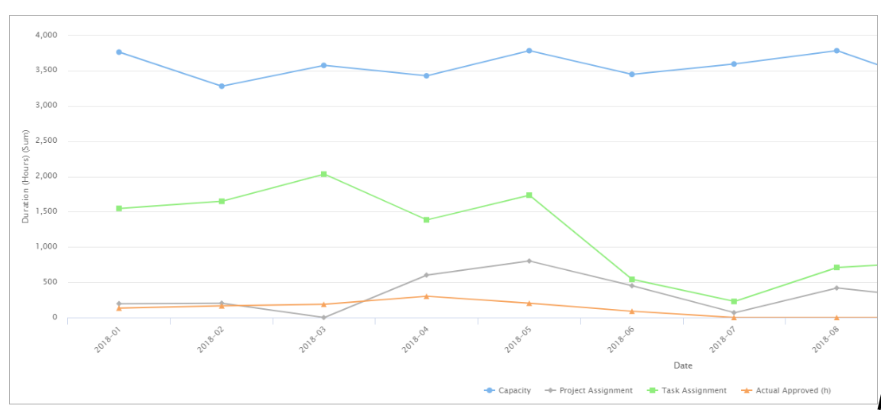
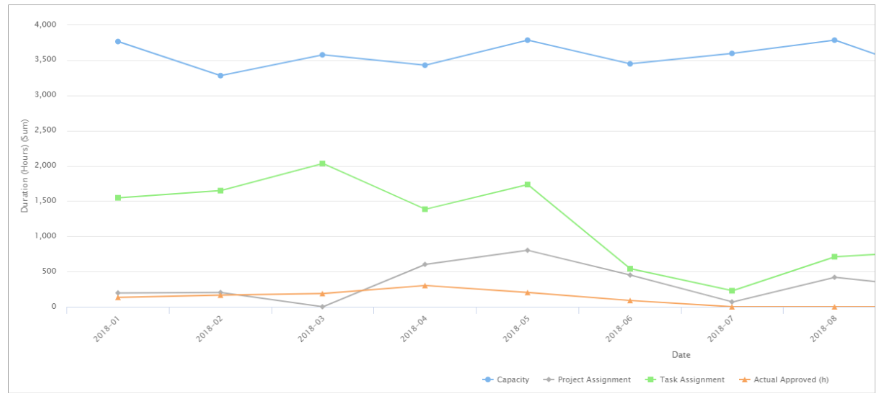
An example chart showing a timeline of your team’s capacity, planned work and actual work. See more chart examples.
Watch this video to find out more about time-phased reports.
NOTES
-
The data is presented in a daily timescale, which you can group by weeks, months or quarters.
-
The reports can include data from the beginning of the previous fiscal year until the end of the following fiscal year. For example, if present is July 2018, a report can include data from January 2017 to December 2019 (provided the fiscal year begins in January).
- Refreshing the Data
- Time-Phased Data and Deletions
- Creating a Time-Phased Report
- Creating an Example Time-Phased Report
- Choosing Related Data to Report On
- Combining Labor and Staffing Request Time-Phased Data
- Examples of Charts in Time-phased Reports
- Best Practices
- Performance for Time-Phased Resource Reports
Refreshing the Data
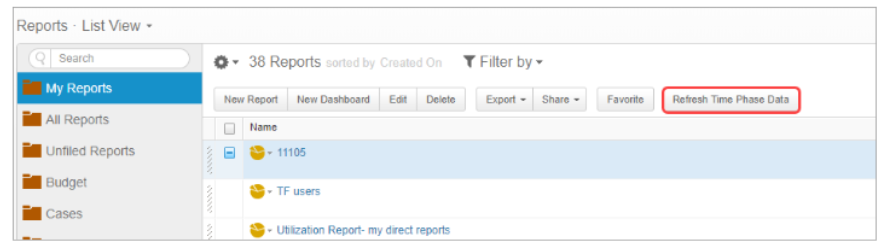
The data is automatically refreshed within a few hours after a change. However, if you are an Admin or Lite Admin and want to view updated data immediately, you can manually refresh all time-phased data (for all reports) up to once every hour. The refresh process can take some time. You will receive an email notification when the refresh is complete.
To refresh manually, click Refresh Time Phase Data in the Reports list.
Time-Phased Data and Deletions
Time-Phased Data is calculated data that is not stored in the database so as to avoid negatively affecting system performance. As a result, Time-Phased Data does not have an external ID nor is it stored in the recycle bin after it is deleted.
There are two types of deletion for Time-Phased Data:
- soft delete – records are marked as deleted in the database
- hard delete – records are deleted from the database
There are differences in how Monthly and Daily Time-Phased data are deleted:
- Monthly Time-Phased data is soft deleted only and saved indefinitely.
- Daily Time-Phased Data is soft deleted for 30 days, after which it is hard deleted.
Restoring Deleted Time-Phased Data
If a soft-deleted record is restored, it retains the same object ID. If a hard-deleted record is restored, it is assigned a new object ID.
For example, if a resource assignment is removed from a task, it is soft deleted (marked as deleted) in the database. After 30 days, the soft deleted resource assignment is hard deleted. If the resource assignment is later reassigned to the task, it is restored with a new object ID.
Creating a Time-Phased Report
NOTE
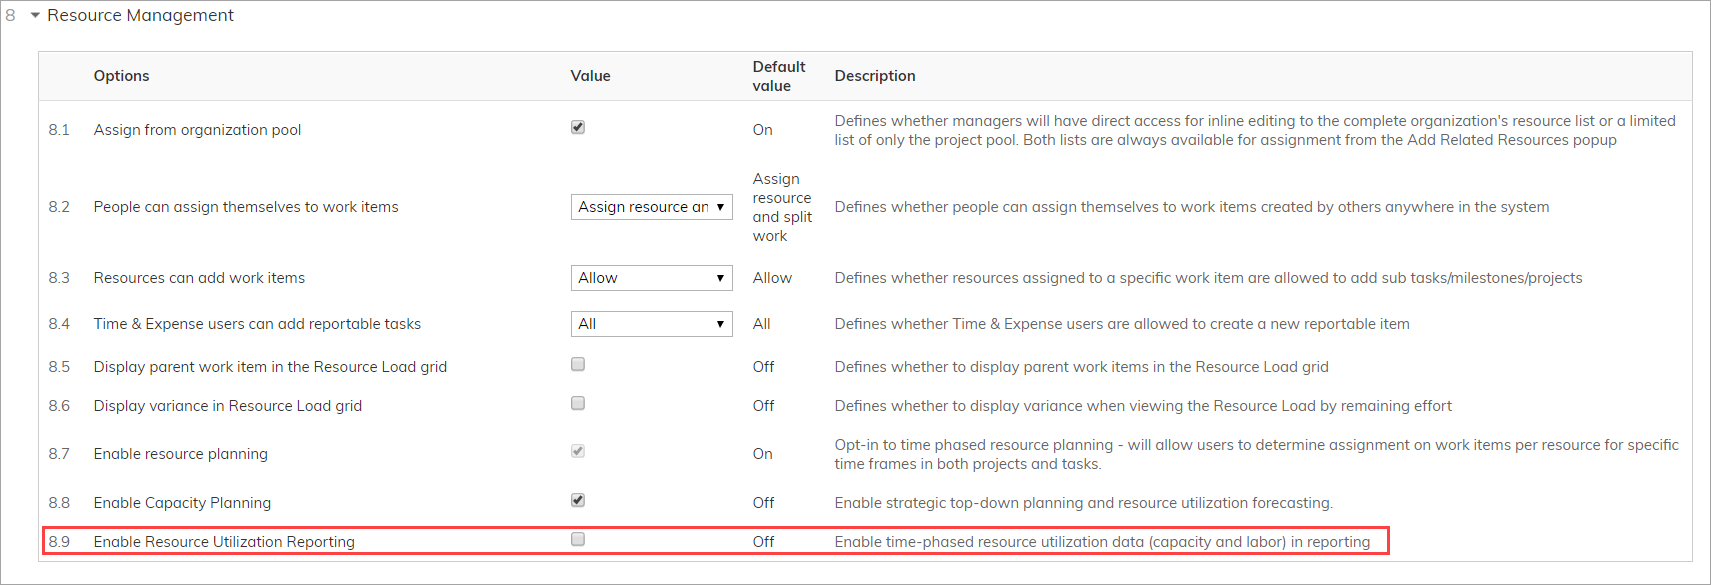
Before you can create Resource Utilization reports, the Enable Resource Utilization Reporting system setting (under Resource Management Settings) must be enabled.
It can take up to 24 hours after the setting is enabled for the Resource Utilization data to become available in reports.
Build time-phased reports from scratch or use out-of-the-box report templates.
To learn more about how to create reports, see Creating and Using Reports.
To create the report:
-
Create a new report.
-
Time-phased reports are based on Time-Phase attributes:
-
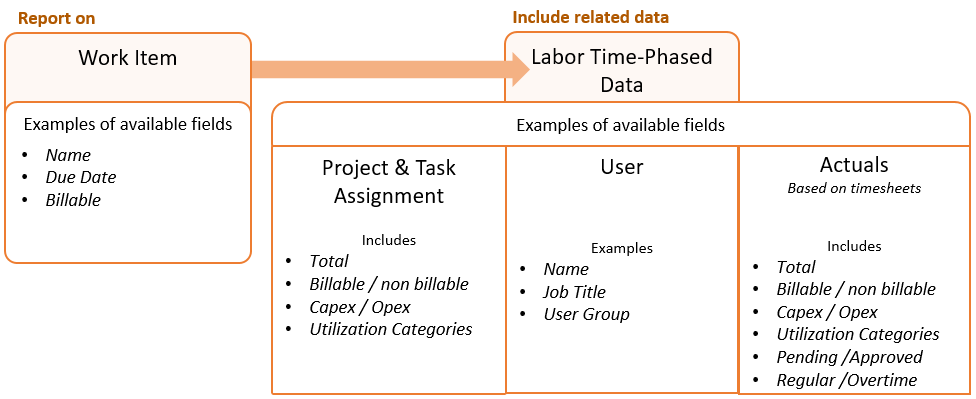
Labor Time Phase Data – based on the resource link (between the user and the Work Item) and timesheets
-
User Capacity Time Phased Data – based on the user calendar. The attributes can be added as related data in the Report on options.
-
Start with Report on, and then include related data. Learn more about choosing related data.
-
Select Monthly for improved performance if you only need data aggregated on a monthly basis. Select Daily if you need daily aggregated data.
-
-
Add highlights to your report. Click here to learn more about creating charts.
-
Add charts to your report. See the example below to learn more about creating time-phased charts.
-
In the Table section, add a basic table with columns, or use a crosstab format with time periods as headers, and repeating columns with time-phased data.
Continue with Adding a Basic Table or Adding a Crosstab Table.
Adding a Basic Table
-
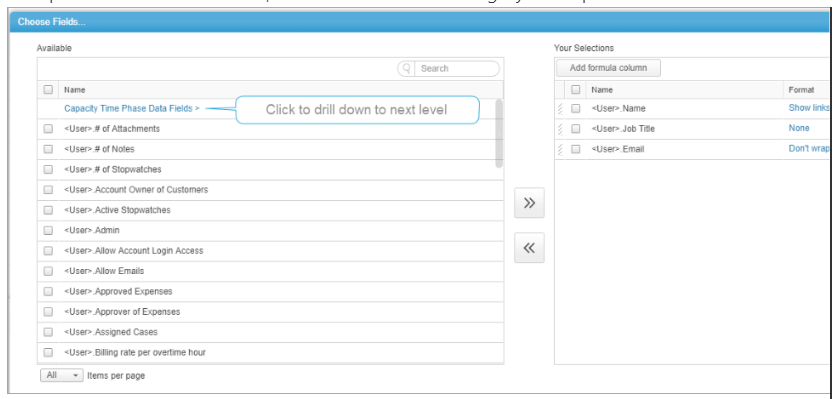
Click Columns and add the required fields to the report.
-
To expose and add related data, click the related data category in the picklist.
-
See Choosing Related Data to explore which fields you can add to the report based on the selected attributes (Report on and related data).
-
Note: To avoid irregular results, do not mix regular fields with time-phased fields in the same report. -
The rest of the procedure is the same as for other reports, and includes adding charts, using formulas, etc. See Creating an Example Time-Phased Report.
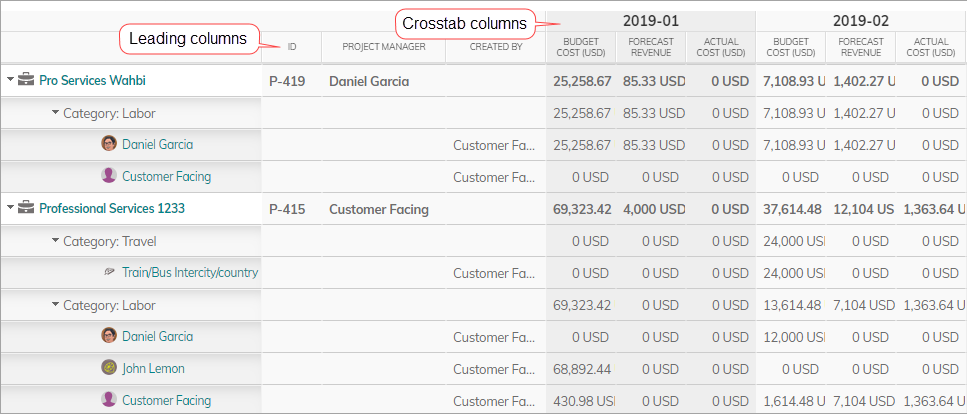
Adding a Crosstab Table
Benefits of the crosstab format include:
-
View and analyze more data in a readable format, with repeating columns and option for leading columns
-
More flexibility for grouping variables (mainly time periods)
-
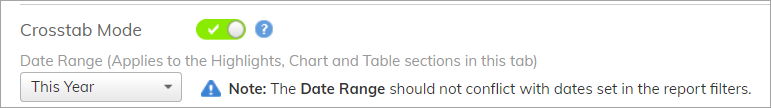
Enable Crosstab mode.
-
Set the Date Range for Highlights, Charts and the Table. Use relative values such as Last Week, Next Quarter, etc., or Between to define a period.
About In the Following and During the PreviousIf you use Monthly time-phased data, then:
- The available units are Month(s) and Quarter(s)
- The actual date range displayed in a report will be:
- In the Following - from the first day of a current month until the end of the last month in the range
- During the Previous - from the first day of the first month in the range until the last day of the previous monthIf you use Daily time-phased data, then:
- The available units are Day(s) and Week(s)
Note: The Date Range should not conflict with dates set in the report filters.
- The actual date range displayed in a report will be:
- In the Following - from the current date until the last day in the range (not included)
- During the Previous - from the first day in the range until the current date (not included)
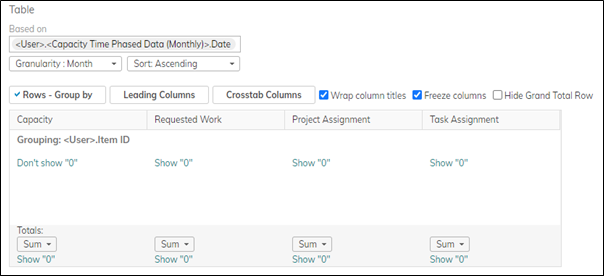
- In the Table section:
- You must have at least one level of granularity.
Optional - Select a Sort option.
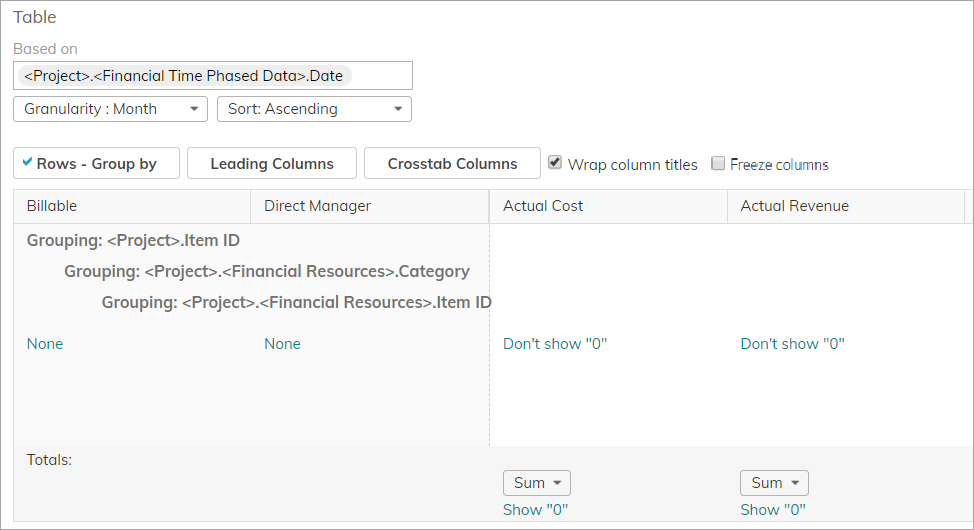
- For Rows - Group by, select up to 3 levels of grouping.
Note: The default first grouping is by Item ID. Item ID is a prerequisite if you want to add leading columns (see next).
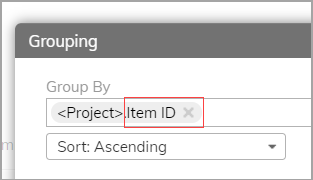
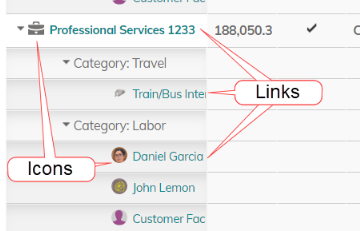
In addition, Item ID supports standard and custom icons, and links on the item names that take you to the related item in a new tab.
- Click Leading Columns (enabled only if you selected Item ID in Grouping). You can now select fields related to the Identifier-type fields selected in the previous step, to appear as leading columns. Add up to 16 leading columns.
- Click Crosstab Columns to select up to 8 repeating columns.
- Set Totals as needed.
- Select the Wrap column titles checkbox.
- Select Freeze columns to freeze the first column and leading columns, useful for horizontal scrolling with lots of columns.
- You must have at least one level of granularity.
- The rest of the procedure is the same as for other reports, and includes adding charts, using formulas, etc. See Creating an Example Time-Phased Report.
Creating an Example Time-Phased Report
The following procedure describes how to create a report with a line chart that shows us how our team is performing, by comparing their capacity, project and task assignments, and actual work.
- Create a new report.
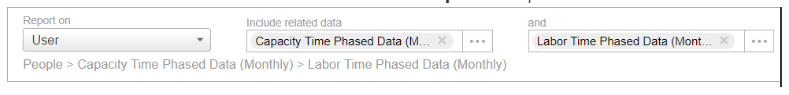
- In the Report on options, enter the following options: User > Capacity Time Phase Data > Labor Time Phase Data
Note: Select Monthly for improved performance if you only need data aggregated on a monthly basis. Select Daily if you need daily or daily aggregated data.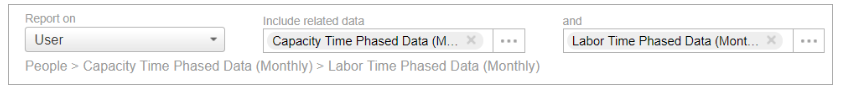
- This combination should be used whenever you want to see all users, their capacity, their planned work, and their actuals.
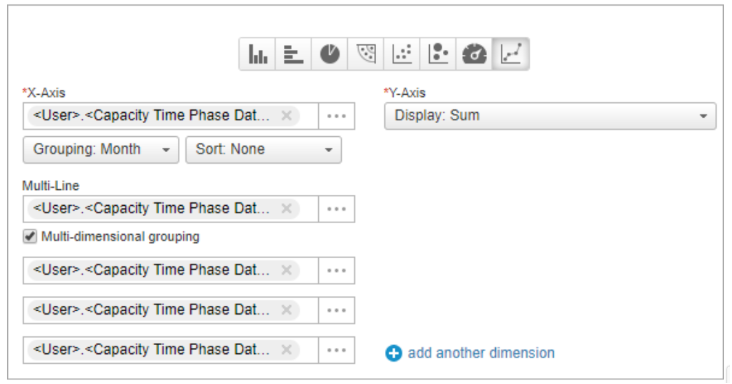
- Click Add Chart, and define the chart as follows:
- Chart Type: Line
- X-Axis: Select Capacity Time Phase Data Fields > Date Group by Month
- Y-Axis: Select Sum to display the total number of hours of all users
- Select Multi-dimensional grouping.
- Define the lines for the Y axis in the chart.
- Select Capacity Time-Phased Data Fields and then the related data. For the first line, select Capacity Time-Phased Data Fields > Capacity.
- For the second line, select Capacity Time-Phased Data Fields > Labor Time Phase Data > Project Assignment.
- For the next 2 lines, repeat the above step and select Task assignment and Actual approved hours.
- Click here to see examples of charts in time-phased reports.
- Customize the related data table. As for all reports, you can choose which columns to include, define grouping, select the format of the column summary, etc.
- Save and run the report.
The line chart
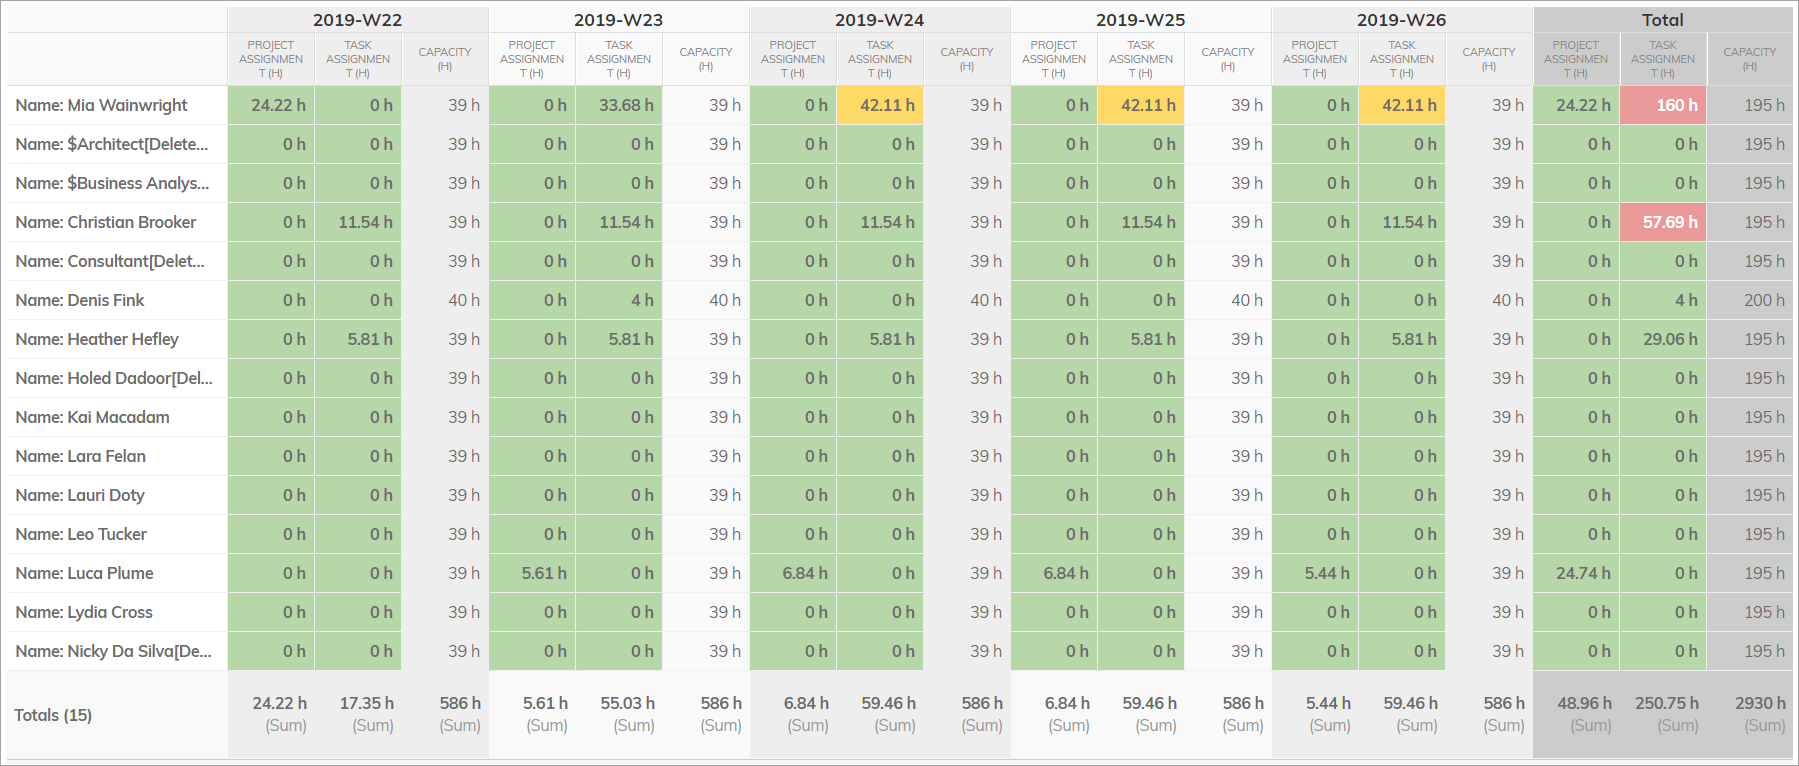
The Data table
Tip: Add some conditional formatting, so that the Project sum displays in red when it’s above capacity, and green when less.
Choosing Related Data to Report On
The following diagrams illustrate how to match related data with use cases.
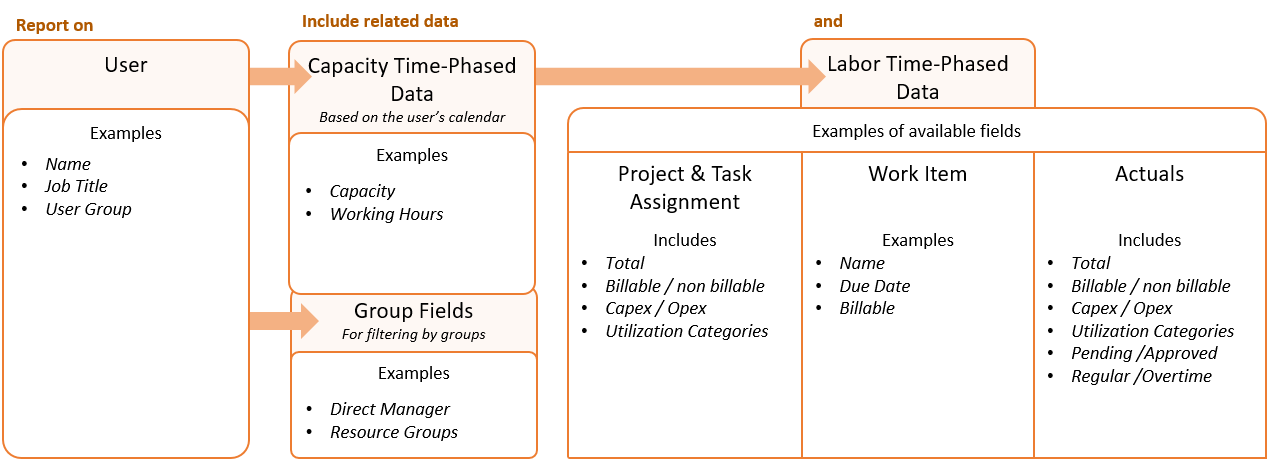
User > Capacity > Labor Time Phased Data
Select the attributes listed in the diagram below to include all users, regardless of if they have work or not, and only Work Items with assigned users appear in the report.
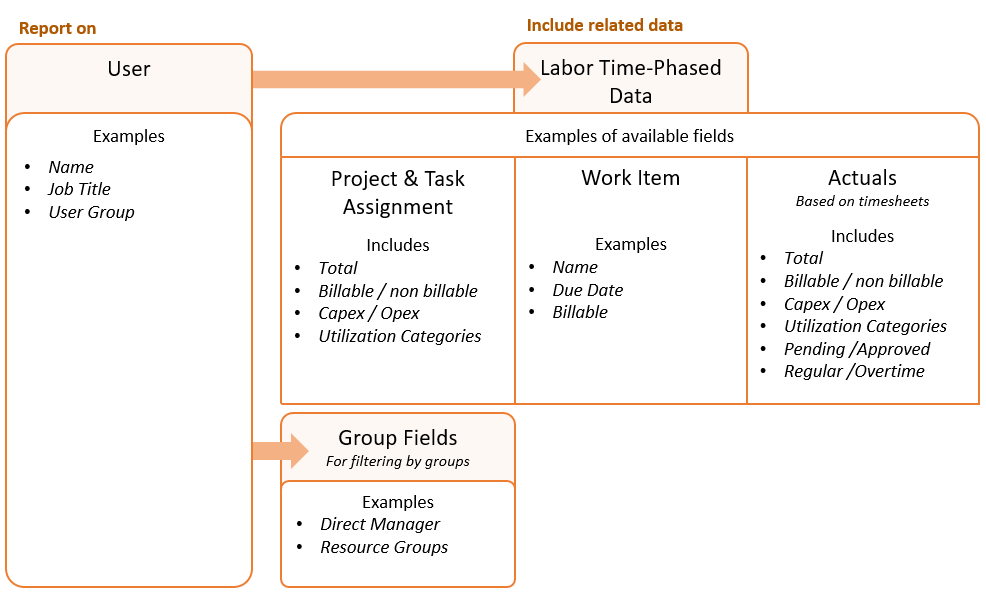
User > Labor Time Phased Data
Select these attributes when the report is more work-focused, without the need for capacity.
Work item > Labor Time-Phased Data
Start from Work Item when you want to see forecast or planned vs. actual at the project level.
All Work Items are included.
Only users with assigned work appear in the report.
Combining Labor and Staffing Request Time-Phased Data
Labor and Staffing Request Time-Phased Data is combined in a single related data item called "Staff Time-Phased Data". It is available as related data in the same places as Labor Time-Phased Data (from the User and Work Item data items) and at the same levels of granularity (Monthly and Daily).
Example report definition

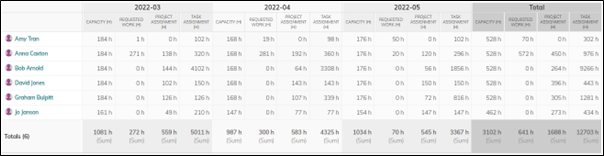
Example crosstab definition
Example crosstab output
"Staff Time-Phased Data" Constraints
- Advanced filters are not supported
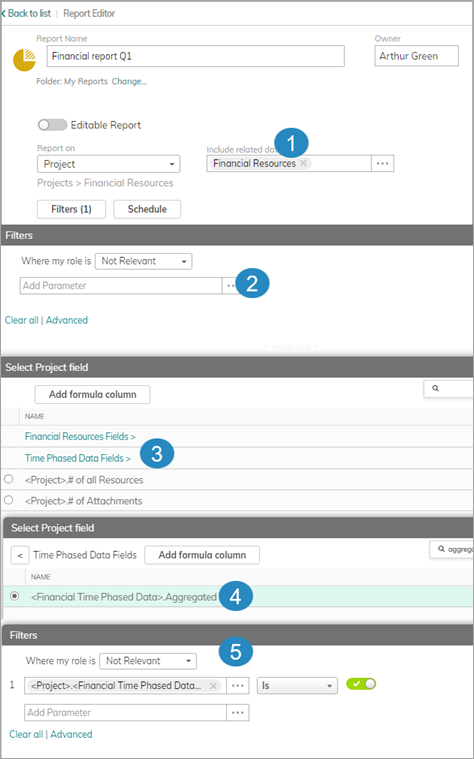
Work item > Financial Resources
Start from Work Item and then the required financial data.
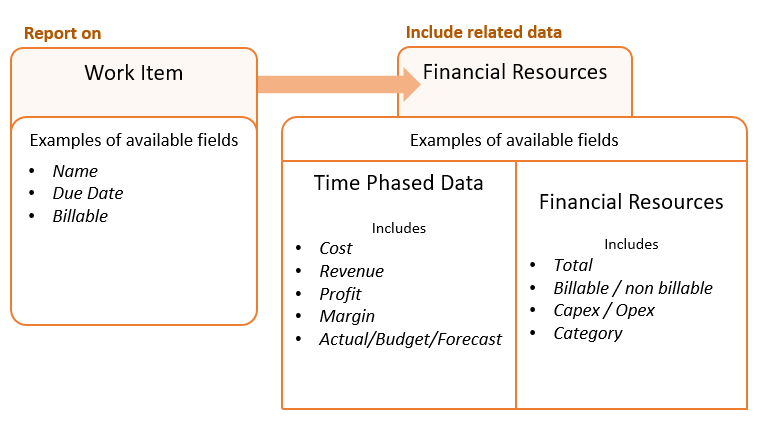
Note: We recommend adding a special filter to display financial resources either in an aggregated, or direct form when using financial time-phased reports. This is to avoid seeing duplicate results.
To add the filter when using Financial Resources as related data (1), add the Time Phased Data Fields parameter (2 + 3). Then choose the Aggregated filter (4+5). Then set this filter to TRUE or FALSE, depending on if you want to see aggregated or direct resources:
Examples of Charts
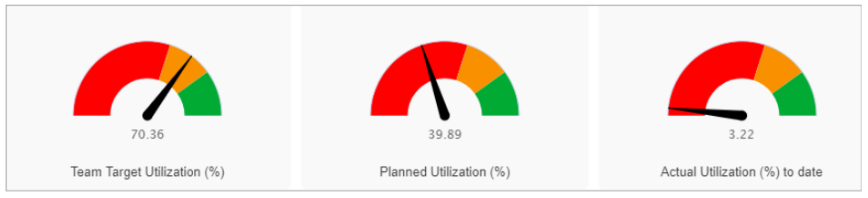
View current (to date), past and planned utilization for your team using gauges.
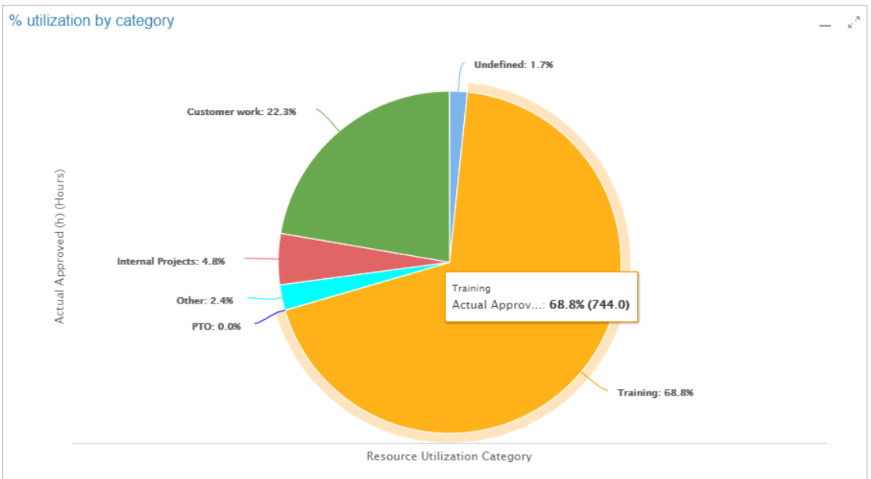
See where your teams are spending their time, based on Work Item categories.
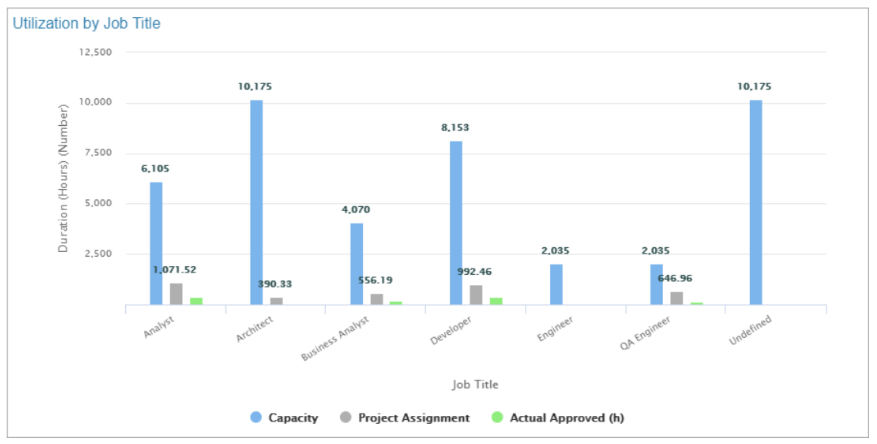
View your team’s utilization by Job Title.
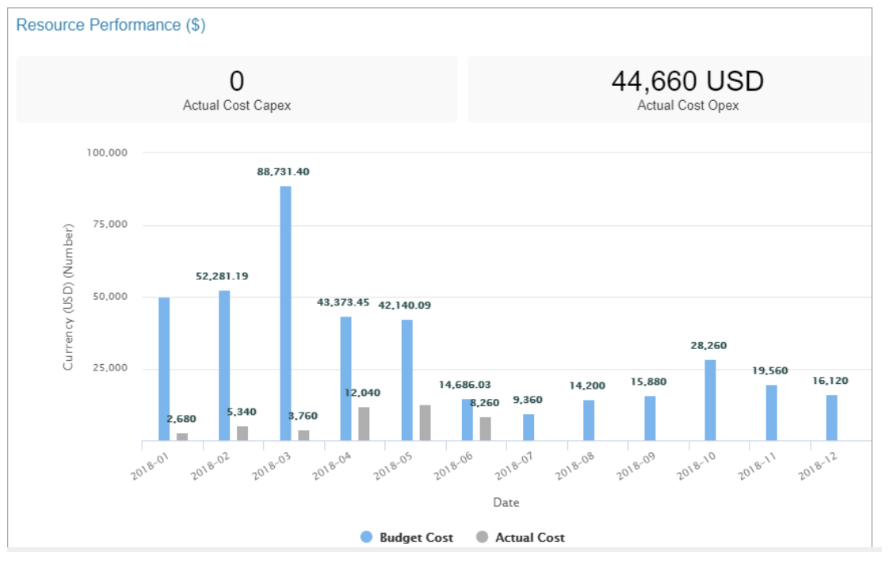
Compare the financial performance of your team over time.
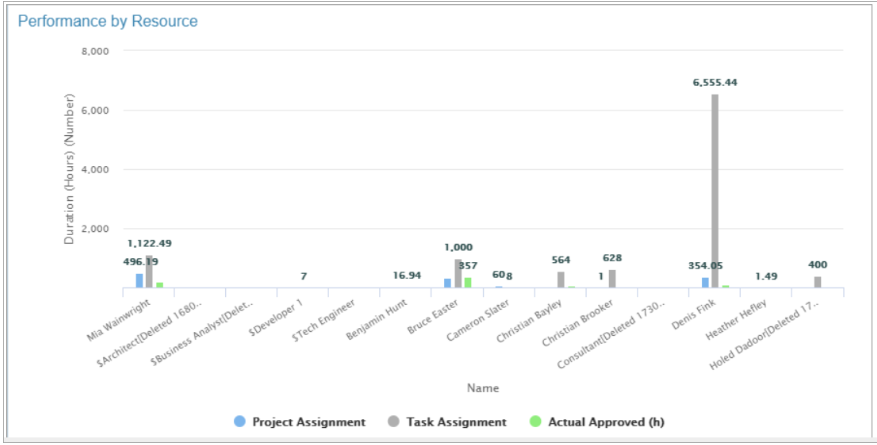
View individual resource utilization.
Best Practices
Jump to:
Formulas
- Use formula-based totals for crosstab columns in your report. This is especially useful in crosstab reports with groupings. See more in Working With the Results Table.
- The following calculations can be used in custom formula-based fields in the report:
- Planned Project Utilization: If(IsNull($CapacityOfUserDaily.LoadFor.LinkObject.ProjectAssignment),0,($CapacityOfUserDaily.LoadFor.LinkObject.ProjectAssignment/$CapacityOfUserDaily.Capacity)*100)
- Actual Utilization: If(IsNull($CapacityOfUserDaily.LoadFor.LinkObject.ActualApproved),0,($CapacityOfUserDaily.LoadFor.LinkObject.ActualApproved/$CapacityOfUserDaily.Capacity)*100)
Filters
We recommend defining filters for reports. This allows you to focus only on relevant data and improves performace with faster loading times. Click here to learn more about creating filters.
There are two things you need to bear in mind when settings filters for time-phased reports:
Dates in Report Filters and Data Table
It is recommended to use the same date ranges in Filters and the data table, to avoid conflicts in the report data.
Unassigned Resources
Filtering on labor-related items when Capacity Time Phased Data is not included in the report automatically excludes unassigned resources from the report.
Report Templates
You can use our report templates to help you get started. You can find the templates under the Resource Utilization and Financials report folders.
Note: Unlike other report templates in AdaptiveWork, the templates for Resource Utilization and Financial reports are visible by default to admins only. To make the templates visible to additional users, an admin must update the viewing/editing permissions for these templates accordingly.
The following templates are available.
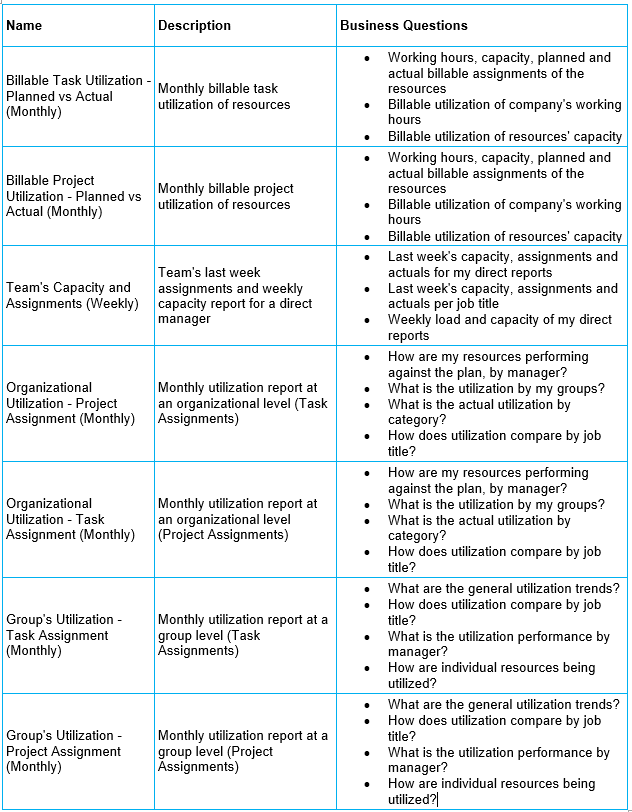
Resource Utilization Reports
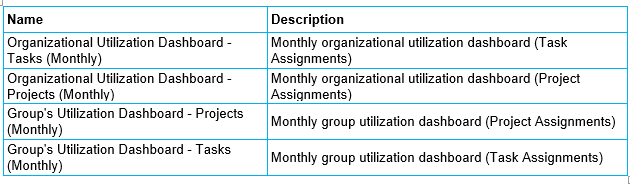
Resource Utilization Dashboards
Financial Reports
Performance for Time-Phased Resource Reports
We have improved the performance and reduced calculation times for time-phased resource reports.
Calculations are now performed for a 3-year period, from the beginning of the previous year until the end of next year. Results outside the calculation timeframe will not be recalculated or updated.